Plots
f_plot
Code
 1function plots = f_plot(results, settings, model_folder)
 2% This function generates plots for various analysis results based on the
 3% provided data and settings.
 4%
 5% Inputs:
 6% - rst: A structure containing results from different types of analyses
 7% (diag, opt, lsa, gsa, PLA).
 8% - stg: A structure containing settings for the plots.
 9% - mmf: A ModelMappingFramework object containing the model and data
10% information.
11%
12% Outputs:
13% - plots: A cell array of generated plots.
14%
15% Used Functions:
16% - f_plot_scores: Generates a figure with scores.
17% - f_plot_inputs: Generates a figure with inputs.
18% - f_plot_outputs: Generates a figure with outputs.
19% - f_plot_in_out: Generates a figure with input and output for all
20% experiments.
21% - f_plot_opt: Generates a figure with optimization results.
22% - f_plot_lsa: Generates figures for Local Sensitivity Analysis.
23% - f_plot_gsa_sensitivities: Generates figures for Global Sensitivity
24% Analysis.
25% - f_plot_PL: Generates a figure for Profile Likelihood Analysis.
26%
27% Variables:
28% Loaded:
29% - data_model: A variable from mmf object containing the data model.
30% - Data: A variable containing data for generating plots.
31% - sbtab: A variable containing sbtab information for generating plots.
32%
33% Initialized:
34% - plots: A cell array for storing generated plot handles.
35
36
37% Set default font and size for plot axes
38set(0, 'defaultAxesFontName', 'Arial')
39set(0, 'defaultAxesFontSize', 10)
40
41% Display a message to inform the user that the plotting process has started
42disp("Plotting ...")
43
44% Retrieve data model from mmf
45data_model = model_folder.model.data.data_model;
46
47% Load data and sbtab from the data model
48load(data_model, 'Data', 'sbtab')
49
50% Initialize an empty array to store generated plot handles
51plots = [];
52
53% Check if the 'diag' field exists in the rst structure
54if isfield(results, 'diag')
55    % Generate and store figure with Scores
56    plots = [plots;f_plot_scores(results.diag, settings, sbtab)];
57
58    plots = f_plot_diagnostics(plots,results,settings,sbtab,Data,model_folder);
59end
60
61% Check if the 'opt' field exists in the rst structure
62if isfield(results, 'opt')
63    % Generate and store figure with optimization results
64    plots = [plots;f_plot_opt(results, settings)];
65end
66
67% Check if the 'lsa' field exists in the rst structure
68if isfield(results, 'lsa')
69    % Generate and store figures for Local Sensitivity Analysis
70    plots = [plots;f_plot_lsa(results.lsa, settings)];
71end
72
73% Check if the 'gsa' field exists in the rst structure
74if isfield(results, 'gsa')
75    % Generate and store figures for Global Sensitivity Analysis
76    plots = [plots;f_plot_gsa_sensitivities(results.gsa, settings, sbtab)];
77end
78
79% Check if the 'PLA' field exists in the rst structure
80if isfield(results, 'PLA')
81    % Generate and store figure for Profile Likelihood Analysis
82    plots = [plots;f_plot_PL(results, settings, model_folder)];
83end
84end
The function that calls all the custom plot functions when appropriate Plots diagnosis that are important to understand if everything is working as it was supposed, it , expected outputs, observed outputs and scores for the models and conditions specified.
Outputs
Figure Scores
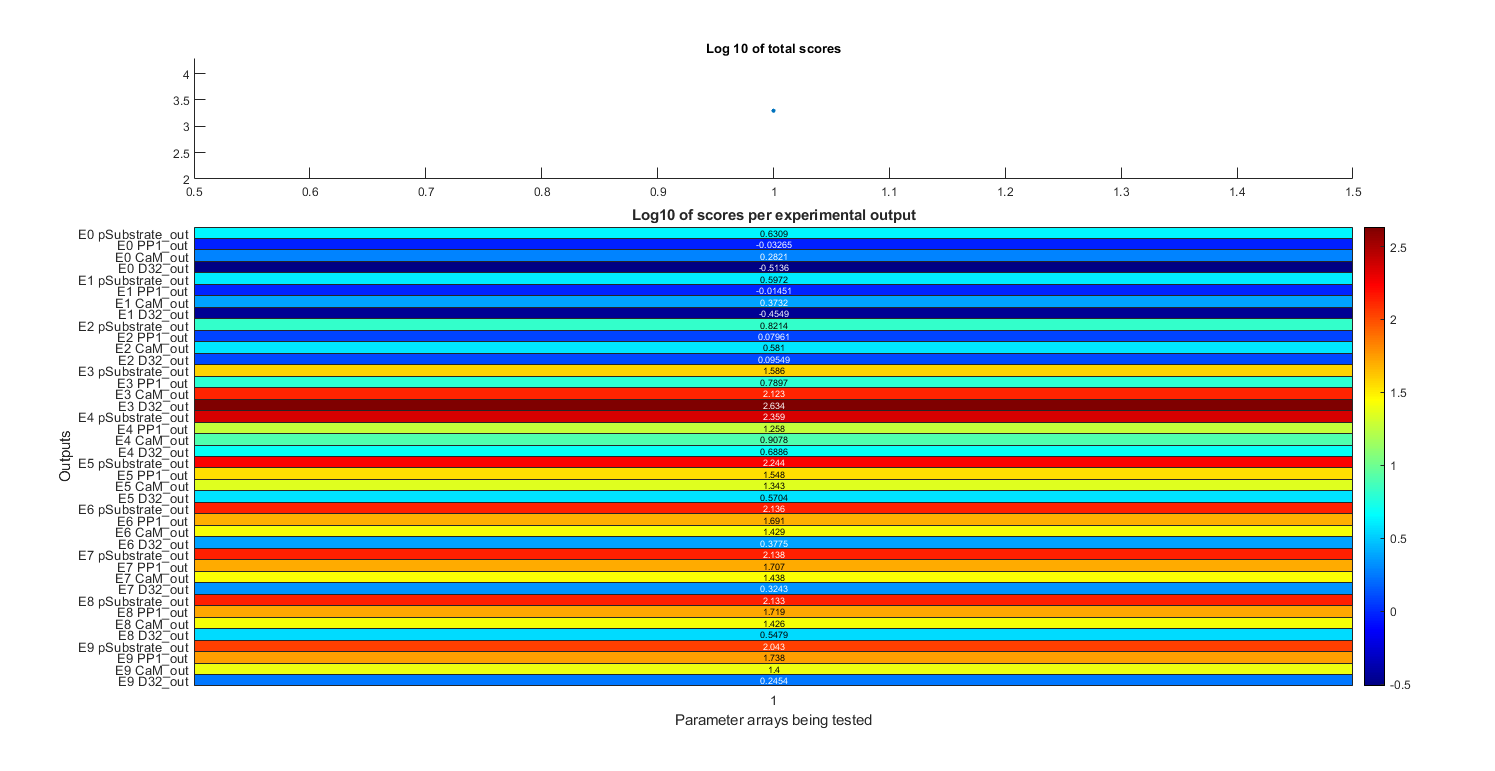
Total scores and scores per dataset given the parameters specified in stg.pa
Code Figure Scores
  1function plots =f_plot_scores(rst,stg,sbtab)
  2% Generates a figure with scores for different experimental outputs and
  3% parameter sets
  4%
  5% Inputs:
  6% - rst: A struct array containing results of the simulations
  7% - stg: A struct containing settings for the simulations
  8% - sbtab: A struct containing information about the datasets used
  9%
 10% Outputs:
 11% - plots: A cell array containing the generated plots
 12%
 13% Functions Called:
 14% - f_set_font_settings: A function to set the font settings for the plot
 15% - f_renew_plot: Closes any existing figures with the specified name and
 16% then creates a new figure with the given name and properties. It returns
 17% a 1x2 cell array containing the figure name and the figure handle.
 18%
 19% Variables
 20% Loaded:
 21% - None
 22%
 23% Initialized:
 24% - layout: A tiled layout object for arranging plots within the figure
 25% - diag_idx: Indices for the different parameter sets
 26% - score_diag: Total scores for each parameter set
 27% - title_texts: Different title texts based on the settings
 28% - title_text: The chosen title text for the top plot
 29% - label: Labels for the heatmap rows
 30% - heatline: Data matrix for the heatmap
 31% - h: A heatmap object
 32%
 33% Persistent:
 34% - None
 35
 36%Font settings
 37f_set_font_settings()
 38
 39% Inform the user that fig1 is being ploted
 40disp("Plotting Scores")
 41
 42% Closes previous instances of the figure and generates a new one
 43plots = f_renew_plot('Scores');
 44
 45layout = tiledlayout(5,1,'Padding','tight','TileSpacing','tight');
 46
 47% Generate top plot of Scores figure
 48nexttile(layout,[1 1]);
 49
 50diag_idx = stg.pat;
 51score_diag = [rst(stg.pat).st];
 52
 53% Plot the total scores of each parameter array to test
 54scatter(diag_idx,score_diag,20,'filled')
 55ylabel('Total Score (s_t)', 'FontSize', Axis_FontSize, 'FontWeight', Axis_Fontweight)
 56set(gca,'xtick',[])
 57% set(gca,'FontSize',10,'Fontweight','bold')
 58
 59% Choose correct title according to settings
 60title_texts = ["Sum of the Score of all Experiments (s_t)",...
 61    "Sum of the Log base 10 of the Score of each Experimental Output", ...
 62    "Sum of the Log base 10 of the Score of each Experiment", ...
 63    "Log base 10 of sum of the Score of all Experiments", ...
 64    "Sum of the Score of all Experiments (s_t)"];
 65title_text = title_texts(stg.useLog+1);
 66
 67title(layout,strrep(stg.plot_name, "_", "\_"),'FontSize', Major_title_FontSize,...
 68    'Fontweight',Major_title_Fontweight);
 69title(title_text,...
 70    "FontSize", Minor_title_FontSize, "FontWeight", Minor_title_Fontweight)
 71
 72% Choose the bounds for the x axis so it aligns with the bottom plot
 73xlim([min(diag_idx)-0.5 max(diag_idx)+0.5])
 74
 75% Generate bottom plot of figure 1
 76nexttile(layout,[4 1]);
 77
 78% Generate labels for left of heatmap (Experiment number Dataset number)
 79label_y = arrayfun(@(n) strcat("E", num2str(n-1), " ", ...
 80    strrep(string(sbtab.datasets(n).output_name), "_", "\_")), ...
 81    stg.exprun, 'UniformOutput', false);
 82label_y = horzcat(label_y{:});
 83
 84for n = stg.pat
 85label_x{n} = "\theta_{" + n + "}";
 86end
 87label_x = horzcat(label_x{:});
 88
 89heatline = cell2mat(arrayfun(@(k) cell2mat(arrayfun(@(n) rst(k).sd(:, n)', ...
 90    stg.exprun, 'UniformOutput', false))', stg.pat, 'UniformOutput', false));
 91
 92heatline( ~any(heatline,2), : ) = [];
 93
 94% Plot the heatmap
 95h = heatmap(heatline,'Colormap',turbo,'YDisplayLabels',label_y, ...
 96    'XDisplayLabels',label_x, 'GridVisible','off','FontSize',7);
 97h.CellLabelFormat = '%.2e';
 98
 99h.Title = "\fontsize{10} \bf Score of each Experimental Output (s_d)";
100h.XLabel = '\fontsize{8} \bf Parameter sets (\theta)';
101h.YLabel = '\fontsize{8} \bf Experimental Outputs';
102end
Figure Inputs
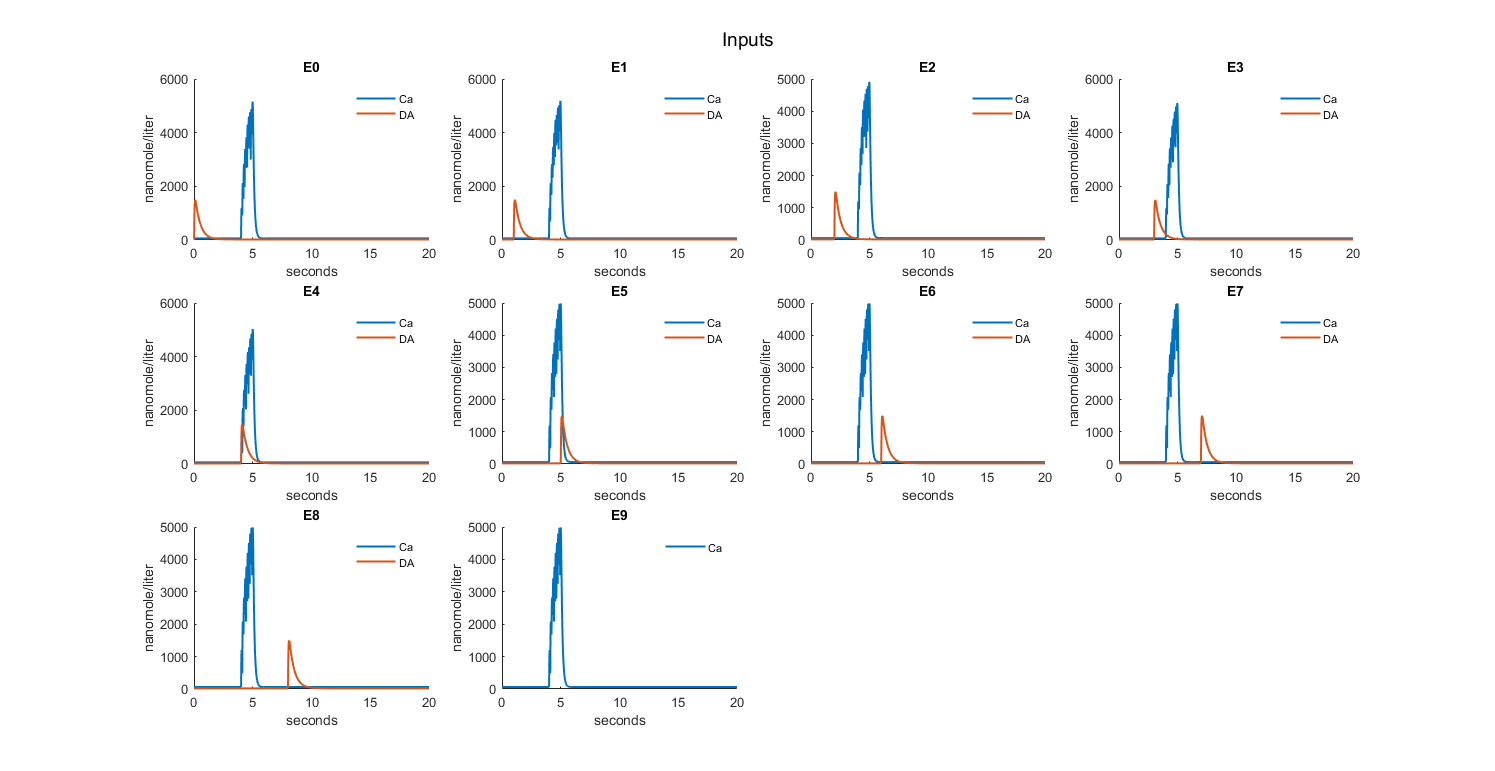
Checks inputs to the model
Code Figure Inputs
Figure Outputs
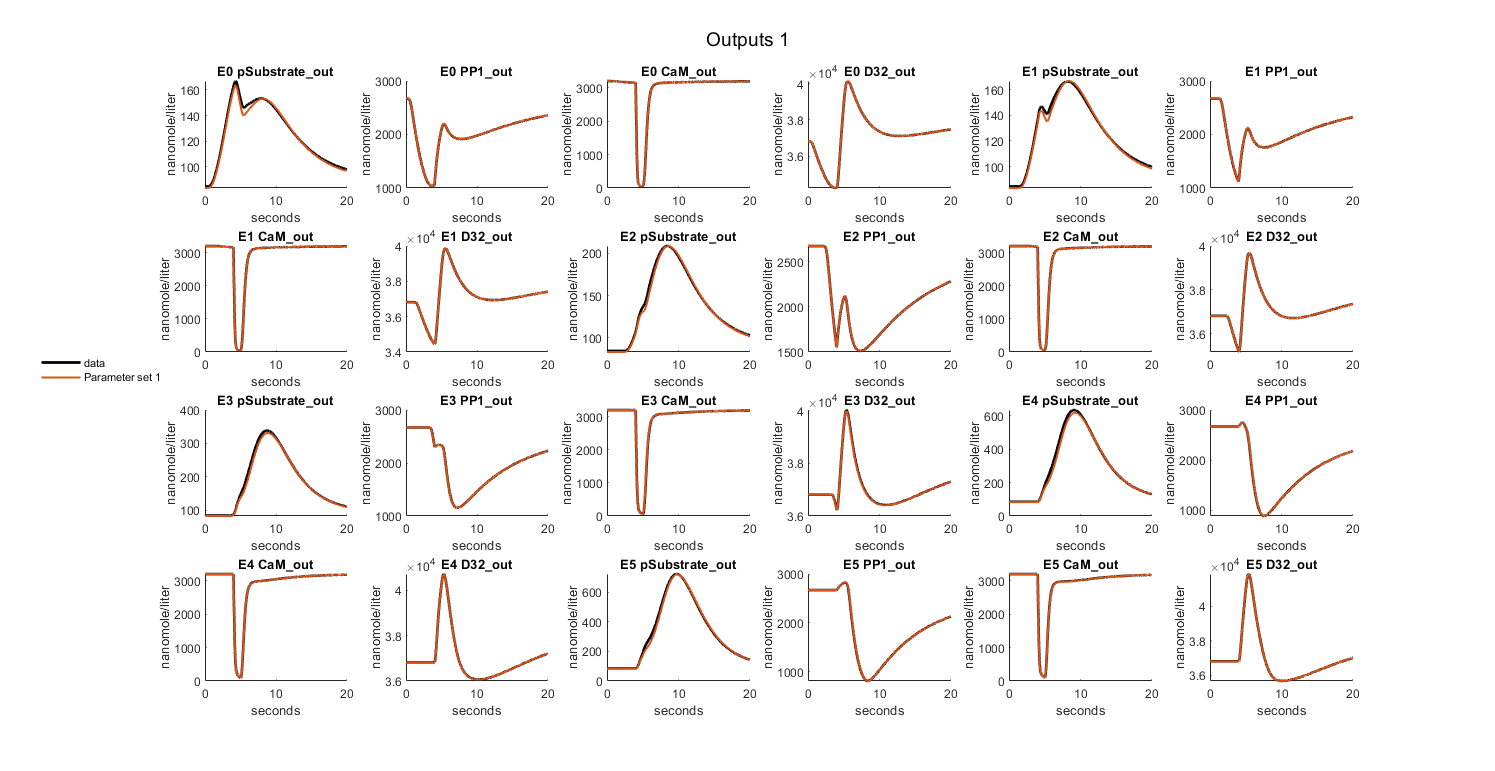
Expected outputs, observed outputs
Code Figure Outputs
Figure Input and Outputs per experiment
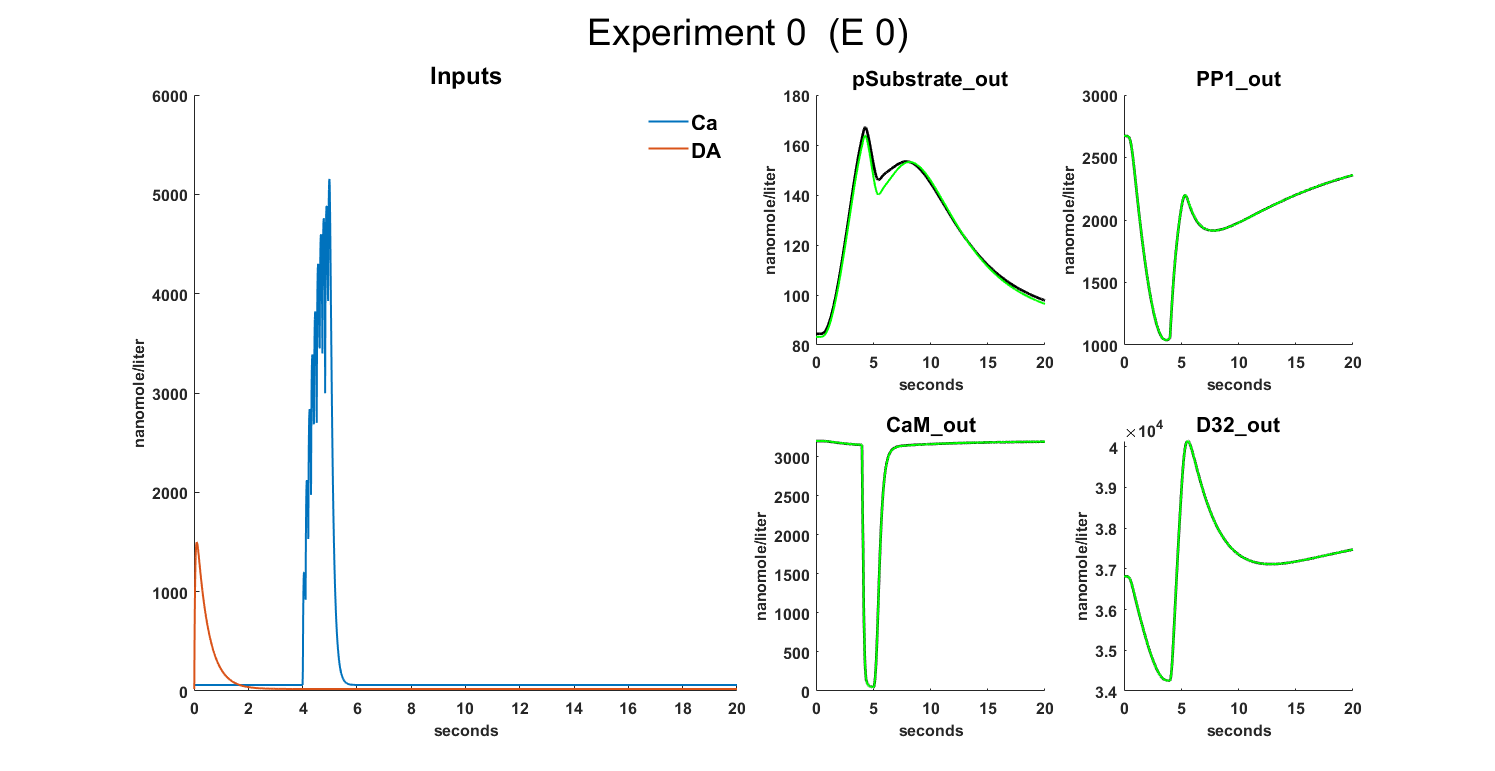
Combined figure of the inputs and outputs for each experiment, on the left side we have the inputs of the experiment and on the right side the outputs
Code Figure Input and Outputs
Figure Sensitivity Analysis \(S_{i}\)
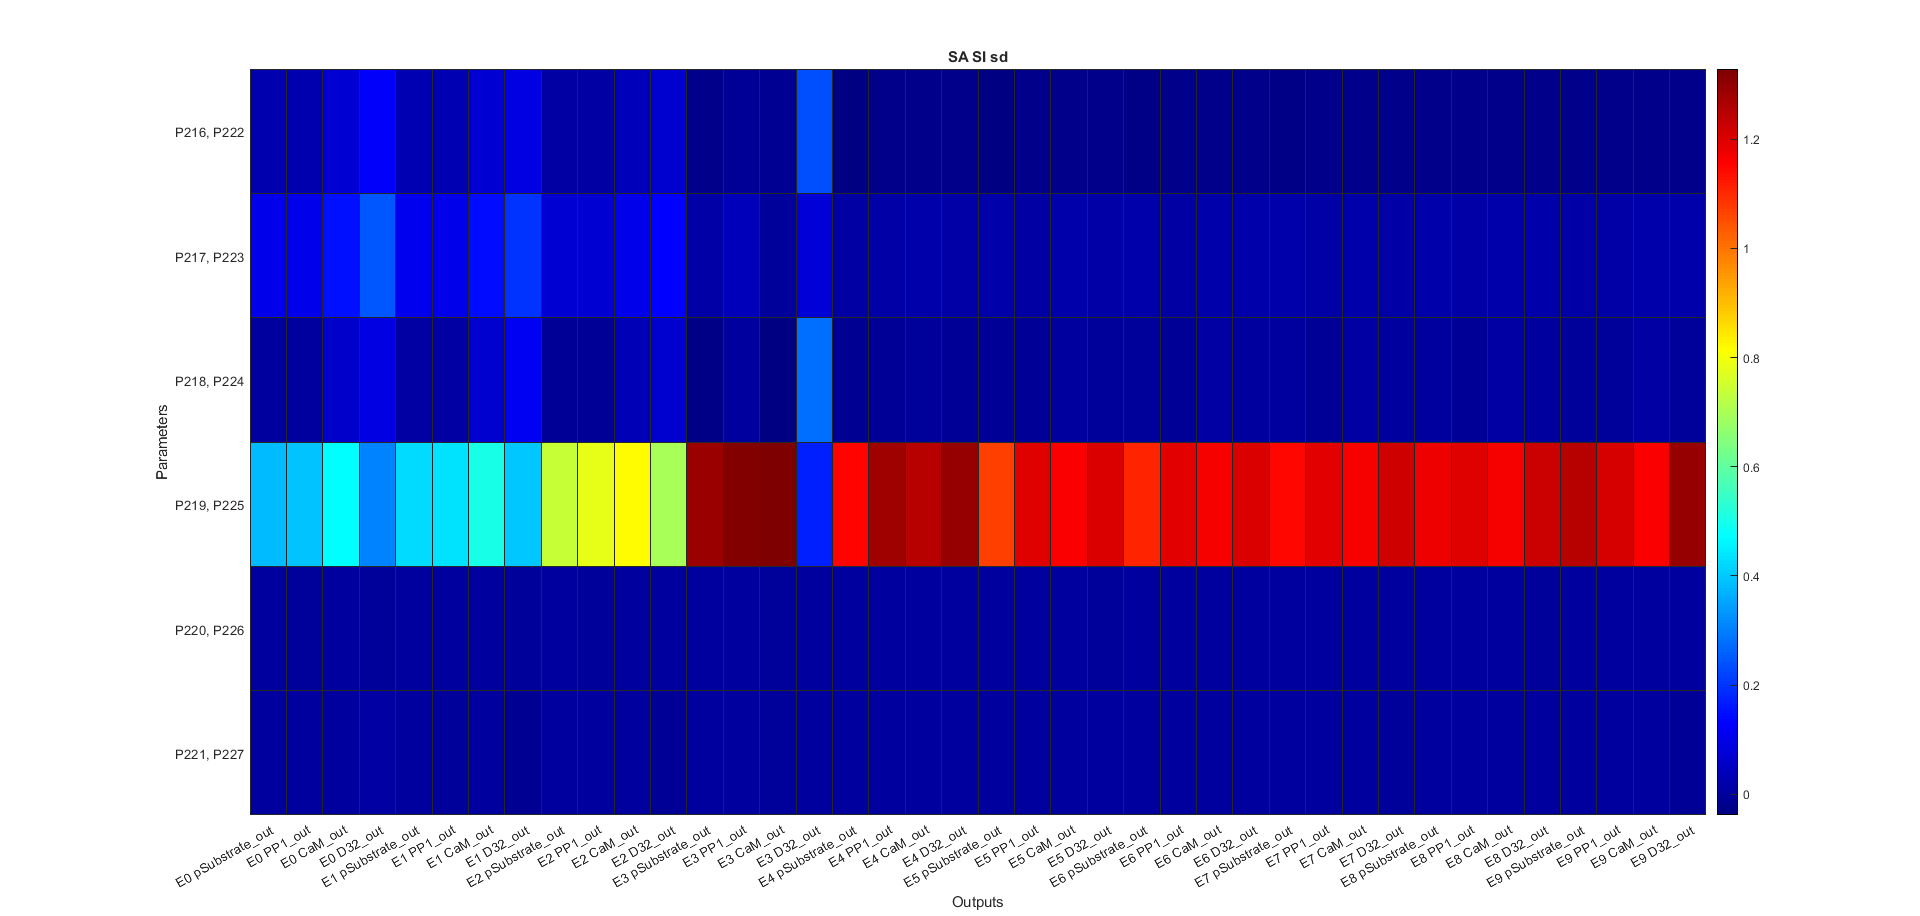
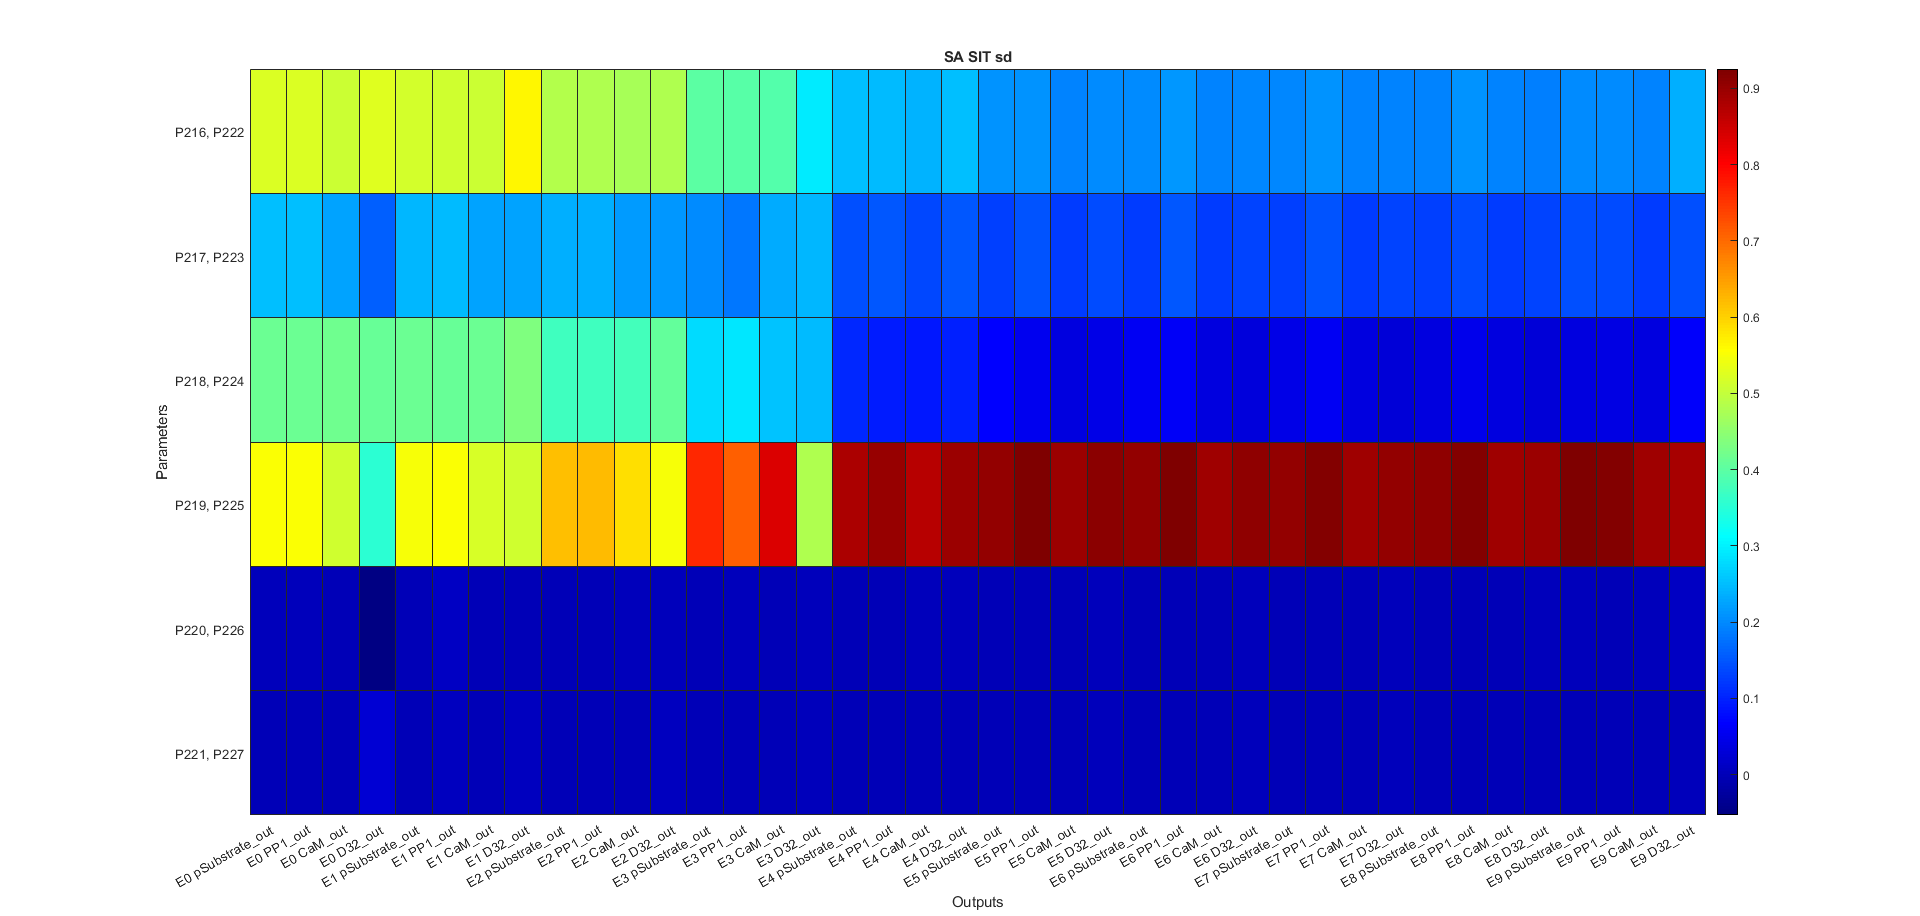
Figure Sensitivity Analysis \(S_{Ti}\)
Code figures SA
  1function plots = f_plot_gsa_sensitivities(results,settings,sbtab)
  2% This function creates plots for Global Sensitivity Analysis. It takes in
  3% results from sensitivity analysis, settings, an SBtab table, and font
  4% settings, then generates a set of plots for each section of the analysis.
  5% The function relies on three helper functions to generate heatmap plots,
  6% compute mean values, and set font settings.
  7%
  8% Inputs:
  9% - results: A structure containing the results from the sensitivity
 10%   analysis
 11% - settings: A structure containing various settings for the analysis
 12% - sbtab: An SBtab table used for creating the outputs
 13% - font_settings: A structure containing the font settings for the plots
 14%
 15% Outputs:
 16% - plots: A cell array containing the generated plots and their names
 17%
 18% Functions called:
 19% - f_generate_plot: Generates a heatmap plot for the given parameters
 20% - get_mean_values: Computes the mean values of an input matrix
 21% - set_font_settings: Sets font settings according to the provided
 22%   configuration
 23% - f_renew_plot: Closes any existing figures with the specified name and
 24% then creates a new figure with the given name and properties. It returns
 25% a 1x2 cell array containing the figure name and the figure handle.
 26%
 27% Variables:
 28% Loaded:
 29% None
 30%
 31% Initialized:
 32% - output_names2: Names of the outputs used in the plots
 33% - par_names: Names of the parameters used in the plots
 34% - par_names2: Modified names of the parameters used in the plots
 35% - plot_sections: Information about each plot section, including name,
 36% title, output_names2, and heatmap_values
 37%
 38% Persistent:
 39% None
 40
 41
 42
 43% Set font settings
 44f_set_font_settings()
 45
 46% Get the total number of outputs
 47[~,output_names.sd] = f_get_outputs(settings,sbtab);
 48
 49% Set output_names2 values
 50for n = 1:size(output_names.sd,2)
 51    output_names.sd{n}{:} = strrep(output_names.sd{n}{:},"_","\_");
 52end
 53for n = settings.exprun
 54    output_names.se{n} = "E " + string(n-1);
 55end
 56output_names.xfinal = output_names.sd;
 57
 58% Set parameter names
 59% par_names = cell(1,settings.parnum);
 60par_names2 = cell(1,settings.parnum);
 61par_names = "P{" + [1:settings.parnum] + "}";
 62for n = 1:settings.parnum
 63    % par_names = n
 64    % par_names{n} = char("P_{" + find(settings.partest==n) + "}");
 65    par_names2{n} = string(par_names{n}(1,:));
 66    % Confirm if can be deleted
 67    % for m = 2:size(par_names{n},1)
 68    %     par_names2{n} = string(par_names2{n}) + ", " +...
 69    %         string(par_names{n}(m,:));
 70    % end
 71end
 72
 73% Define plot sections
 74plot_sections = {
 75    % Bootstrapping quartile mean of first order Sensitivity index for
 76    % score per Experimental Output
 77    "Si seo bm", ...
 78    ["First order Sensitivities",...
 79    "calculated using the Score of each Experimental Output",...
 80    "(Bootstrapping Mean)"],...
 81    "output_names.sd", "get_mean_values(results.SiQ.sd,settings)";
 82    % Bootstrapping quartile mean of total order Sensitivity index for
 83    % score per Experimental Output
 84    "SiT seo bm",...
 85    ["Total order Sensitivities",...
 86    " calculated using the Score of each Experimental Output ",...
 87    " (Bootstrapping Mean)"],...
 88    "output_names.sd", "get_mean_values(results.SiTQ.sd,settings)";
 89    % Bootstrapping quartile mean of first order Sensitivity index for
 90    % score per Experiments
 91    "Si se bm",...
 92    ["First order Sensitivities",...
 93    " calculated using the Score of each Experiment",...
 94    "(Bootstrapping Mean)"],...
 95    "output_names.se", "get_mean_values(results.SiQ.se,settings)";
 96    % Bootstrapping quartile mean of total order Sensitivity index for
 97    % score per Experiments
 98    "SiT se bm",...
 99    ["Total order Sensitivities",...
100    " calculated using the Score of each Experiment",...
101    "(Bootstrapping Mean)"],...
102    "output_names.se", "get_mean_values(results.SiTQ.se,settings)";
103    % Bootstrapping quartile mean of first order Sensitivity index for the
104    % final points of the simulations for the output beeing measured
105    "Si xfinal bm",...
106    ["First order Sensitivities",...
107    " calculated using the final value of each Experimental Output",...
108    "(Bootstrapping Mean)"],...
109    "output_names.xfinal", "get_mean_values(results.SiQ.xfinal,settings)"
110    % Bootstrapping quartile mean of total order Sensitivity index for the
111    % final points of the simulations for the output beeing measured
112    "SiT xfinal bm",...
113    ["Total order Sensitivities",...
114    " calculated using the final value of each Experimental Output",...
115    "(Bootstrapping Mean)"],...
116    "output_names.xfinal", "get_mean_values(results.SiTQ.xfinal,settings)"
117    };
118
119% Generate plots for each section
120for i = 1:size(plot_sections, 1)
121    [plots(i,:)] = f_generate_plot(results, settings, output_names,...
122        par_names2, plot_sections{i, 1}, plot_sections{i, 2},...
123        plot_sections{i, 3}, plot_sections{i, 4});
124end
125
126% Create Si, SiT plot
127plots(7,:) = f_renew_plot('Si,SiT');
128
129layout = tiledlayout(1,1,'Padding','tight','TileSpacing','tight');
130nexttile(layout)
131
132for n = 1:size(par_names2,2)
133    a{n} = char(par_names2{n});
134end
135
136a = categorical(a,a);
137
138bar(a,[transpose(results.Si.st(:,1:settings.parnum)),...
139    transpose(results.SiT.st(:,1:settings.parnum))])
140set(gca,'FontSize', Axis_FontSize);
141xlabel('Parameters','FontSize', Axis_FontSize,...
142    'Fontweight',Axis_Fontweight);
143ylabel('Sensitivity','FontSize', Axis_FontSize,...
144    'Fontweight',Axis_Fontweight);
145title(layout,[strrep(settings.plot_name, "_", "\_"), ...
146    "  Sensitivities calculated using the sum of the Score of all Experiments"],...
147    'FontSize',Major_title_FontSize,'Fontweight',Major_title_Fontweight);
148leg = legend({'S_{Fi}','S_{Ti}'},'Location','best',...
149    'FontSize', Legend_FontSize,'Fontweight',Legend_Fontweight);
150leg.ItemTokenSize = Legend_ItemTokenSize;
151legend boxoff
152
153% Create Si, SiT bootstraping plot
154plots(8,:) = f_renew_plot('Si,SiT b');
155
156
157layout = tiledlayout(1,1,'Padding','tight','TileSpacing','tight');
158nexttile(layout)
159
160T = [];
161
162for n = 1:size(a,2)
163    for m = 1:size(results.SiQ.st(:,n),1)
164        T = [T;table(results.SiQ.st(m,n),a(n),"Si")];
165    end
166end
167for n = 1:size(a,2)
168    for m = 1:size(results.SiTQ.st(:,n),1)
169        T = [T;table(results.SiTQ.st(m,n),a(n),"SiT")];
170    end
171end
172
173boxchart(T.Var2,T.Var1,'GroupByColor',T.Var3,...
174    'MarkerStyle','.','JitterOutliers','on')
175set(gca,'FontSize', Axis_FontSize);
176xlabel('Parameters','FontSize',...
177    Axis_FontSize,'Fontweight',Axis_Fontweight);
178ylabel('Sensitivity','FontSize',...
179    Axis_FontSize,'Fontweight',Axis_Fontweight);
180title(layout,[strrep(settings.plot_name, "_", "\_"), ...
181    "Sensitivities calculated using the sum of the Score of all Experiments"],...
182    'FontSize',Major_title_FontSize,'Fontweight',Major_title_Fontweight);
183
184subtitle(layout,'(Bootstrapping)','FontSize', Major_subtitle_FontSize,...
185    'Fontweight',Major_subtitle_Fontweight);
186leg = legend({'S_{Fi}','S_{Ti}'},'Location','best',...
187    'FontSize', Legend_FontSize,'Fontweight',Legend_Fontweight);
188leg.ItemTokenSize = Legend_ItemTokenSize;
189legend boxoff
190end
191
192function [plots] =...
193    f_generate_plot(results,settings,output_names,par_names2,name,major_title,...
194    output_names_2,heatmap_values)
195% Function to generate heatmap plot for the given parameters
196
197% Set font settings
198f_set_font_settings()
199
200plots = f_renew_plot(name);
201
202layout = tiledlayout(1,1,'Padding','tight','TileSpacing','none');
203nexttile(layout)
204
205fixed_output_names2 = eval(output_names_2);
206fixed_output_names2 =...
207    fixed_output_names2(~cellfun('isempty',fixed_output_names2));
208
209fixed_heatmap_values = eval(heatmap_values);
210fixed_heatmap_values =...
211    fixed_heatmap_values(:,all(~isnan(fixed_heatmap_values)));
212
213% h = heatmap(fixed_output_names2,par_names2,...
214%     fixed_heatmap_values,'Colormap',turbo,...
215%     'ColorLimits',[0 1],'GridVisible','off',FontSize=Axis_FontSize);
216h = heatmap(fixed_output_names2,par_names2,...
217    fixed_heatmap_values,'Colormap',turbo,...
218    'ColorLimits',[0 1],FontSize=Axis_FontSize);
219
220hHeatmap = struct(h).Heatmap;
221hGrid = struct(hHeatmap).Grid;
222hGrid.ColorData = uint8([77;77;77;255]);
223
224h.CellLabelFormat = '%.2f';
225
226title(layout,strrep(settings.plot_name, "_", "\_") + "  " + ...
227    major_title(1),'FontSize', Major_title_FontSize,...
228    'Fontweight',Major_title_Fontweight);
229subtitle(layout,major_title(2:end),'FontSize', Major_subtitle_FontSize,...
230    'Fontweight',Major_subtitle_Fontweight)
231
232% title(strrep(settings.plot_name, "_", "\_") + "  " + ...
233%     major_title(1),'FontSize', Major_title_FontSize,...
234%     'Fontweight',Major_title_Fontweight);
235% subtitle(major_title(2:end),'FontSize', Major_subtitle_FontSize,...
236%     'Fontweight',Major_subtitle_Fontweight)
237
238h.XLabel = '\fontsize{8} \bf Outputs';
239h.YLabel = '\fontsize{8} \bf Parameters';
240end
241
242function mean_values = get_mean_values(input_matrix,settings)
243% Function to compute the mean values of the input matrix
244
245mean_values = transpose(reshape(mean(input_matrix(:,:,1:settings.parnum)),...
246    [size(input_matrix,2),size(input_matrix,3)]));
247end
Calls
Loads - data.mat
f_get_subplot
Code
 1function [figure_number,layout,plots] =...
 2    f_get_subplot(plot_total_n,plot_n,figure_number,fig_name,layout,plots)
 3% Determines the layout for subplots, creates a new figure when needed, and
 4% closes previous instances of the figure.
 5%
 6% Inputs:
 7% - plot_total_n: Total number of plots to display
 8% - plot_n: Current plot number
 9% - figure_number: Current figure number
10% - fig_name: Figure name as a string
11% - layout: Layout object to be updated with new configuration
12% - plots: Cell array containing figure handles and names
13%
14% Outputs:
15% - figure_number: Updated figure number
16% - layout: Updated layout object
17% - plots: Updated cell array with figure handles and names
18%
19% Functions called:
20% - create_new_figure: Closes any existing figure with the same name,
21% then creates a new docked figure with the given name
22% - calculate_layout: Calculates the layout for the current figure based
23% on the figure number, total number of plots, maximum size, and subplot
24% dimensions
25% - f_renew_plot: Closes any existing figures with the specified name and
26% then creates a new figure with the given name and properties. It returns
27% a 1x2 cell array containing the figure name and the figure handle.
28%
29% Variables:
30% Loaded:
31% None
32%
33% Initialized:
34% - size_total: Maximum number of plots per figure
35% - size_x: Array of subplot layout column counts
36% - size_y: Array of subplot layout row counts
37%
38% Persistent:
39% None
40
41size_total = 12;
42
43size_x = [1,1,1,2,2,2,2,2,3,3,3,3];
44size_y = [1,2,3,2,3,3,4,4,3,4,4,4];
45
46if mod(plot_n,size_total) == 0
47    figure_number = figure_number + 1;
48    % If the total number of plots exceeds the maximum per figure, create
49    % additional figures and update the figure name.
50    if plot_total_n > size_total
51        fig_name = fig_name + " " + figure_number;
52    end
53
54    % Close previous instances of the figure and create a new one.
55    plots = f_renew_plot(fig_name);
56
57    % Calculate the layout for the current figure based on the total number
58    % of plots, maximum size, and the dimensions of the subplot.
59    layout =...
60        calculate_layout(figure_number, plot_total_n,...
61        size_total, size_x, size_y);
62end
63end
64
65function layout = ...
66    calculate_layout(figure_number, plot_total_n,...
67    size_total, size_x, size_y)
68% This function calculates the layout for the current figure based on the
69% figure number, total number of plots, maximum size, and subplot
70% dimensions.
71
72if figure_number <= floor(plot_total_n/size_total)
73    % If the current figure is not the last one, use the maximum size
74    % dimensions for the layout.
75    layout = tiledlayout(size_x(size_total), size_y(size_total),...
76        'Padding', 'none', 'TileSpacing', 'tight');
77else
78    % If the current figure is the last one, calculate the remaining number
79    % of plots and use the corresponding dimensions for the layout.
80    remaining_plots =...
81        plot_total_n - (floor(plot_total_n/size_total) * size_total);
82
83    layout =...
84        tiledlayout(size_x(remaining_plots), size_y(remaining_plots),...
85        'Padding', 'none', 'TileSpacing', 'tight');
86end
87end
Inputs
Outputs
Calls
Loads