Plots
f_plot
Code
 1function plots = f_plot(results, settings, model_folder)
 2% This function generates plots for various analysis results based on the
 3% provided data and settings.
 4%
 5% Inputs:
 6% - rst: A structure containing results from different types of analyses
 7% (diag, opt, lsa, gsa, PLA).
 8% - stg: A structure containing settings for the plots.
 9% - mmf: A ModelMappingFramework object containing the model and data
10% information.
11%
12% Outputs:
13% - plots: A cell array of generated plots.
14%
15% Used Functions:
16% - f_plot_scores: Generates a figure with scores.
17% - f_plot_inputs: Generates a figure with inputs.
18% - f_plot_outputs: Generates a figure with outputs.
19% - f_plot_in_out: Generates a figure with input and output for all
20% experiments.
21% - f_plot_opt: Generates a figure with optimization results.
22% - f_plot_lsa: Generates figures for Local Sensitivity Analysis.
23% - f_plot_gsa_sensitivities: Generates figures for Global Sensitivity
24% Analysis.
25% - f_plot_PL: Generates a figure for Profile Likelihood Analysis.
26%
27% Variables:
28% Loaded:
29% - data_model: A variable from mmf object containing the data model.
30% - Data: A variable containing data for generating plots.
31% - sbtab: A variable containing sbtab information for generating plots.
32%
33% Initialized:
34% - plots: A cell array for storing generated plot handles.
35
36
37% Set default font and size for plot axes
38set(0, 'defaultAxesFontName', 'Arial')
39set(0, 'defaultAxesFontSize', 10)
40
41% Display a message to inform the user that the plotting process has started
42disp("Plotting ...")
43
44% Retrieve data model from mmf
45data_model = model_folder.model.data.data_model;
46
47% Load data and sbtab from the data model
48load(data_model, 'Data', 'sbtab')
49
50% Initialize an empty array to store generated plot handles
51plots = [];
52
53% Check if the 'diag' field exists in the rst structure
54if isfield(results, 'diag')
55    % Generate and store figure with Scores
56    plots = [plots;f_plot_scores(results.diag, settings, sbtab)];
57    % Generate and store figure with Inputs
58    plots = [plots;f_plot_inputs(results.diag, settings, sbtab)];
59    % Generate and store figure with Outputs
60    plots = [plots;f_plot_outputs(results.diag, settings, sbtab, Data, model_folder)];
61    % Generate and store figure with Input and Output for all experiments
62    plots = [plots;f_plot_in_out(results.diag, settings, sbtab, Data, model_folder)];
63end
64
65% Check if the 'opt' field exists in the rst structure
66if isfield(results, 'opt')
67    % Generate and store figure with optimization results
68    plots = [plots;f_plot_opt(results, settings)];
69end
70
71% Check if the 'lsa' field exists in the rst structure
72if isfield(results, 'lsa')
73    % Generate and store figures for Local Sensitivity Analysis
74    plots = [plots;f_plot_lsa(results.lsa, settings)];
75end
76
77% Check if the 'gsa' field exists in the rst structure
78if isfield(results, 'gsa')
79    % Generate and store figures for Global Sensitivity Analysis
80    plots = [plots;f_plot_gsa_sensitivities(results.gsa, settings, sbtab)];
81end
82
83% Check if the 'PLA' field exists in the rst structure
84if isfield(results, 'PLA')
85    % Generate and store figure for Profile Likelihood Analysis
86    plots = [plots;f_plot_PL(results, settings, model_folder)];
87end
88end
The function that calls all the custom plot functions when appropriate Plots diagnosis that are important to understand if everything is working as it was supposed, it , expected outputs, observed outputs and scores for the models and conditions specified.
Outputs
Figure Scores
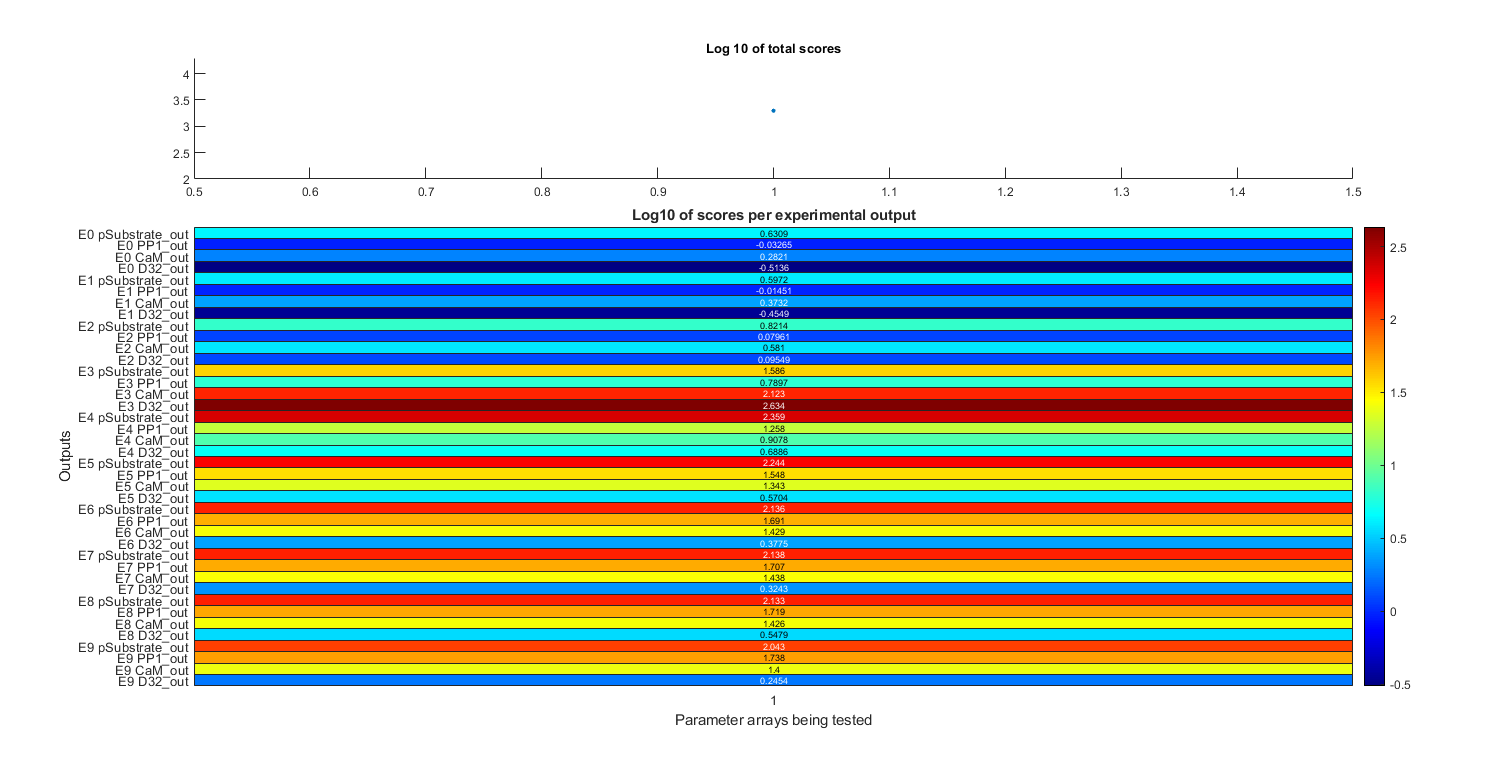
Total scores and scores per dataset given the parameters specified in stg.pa
Code Figure Scores
 1function plots =f_plot_scores(rst,stg,sbtab)
 2% Generates a figure with scores for different experimental outputs and
 3% parameter sets
 4%
 5% Inputs:
 6% - rst: A struct array containing results of the simulations
 7% - stg: A struct containing settings for the simulations
 8% - sbtab: A struct containing information about the datasets used
 9%
10% Outputs:
11% - plots: A cell array containing the generated plots
12%
13% Functions Called:
14% - f_set_font_settings: A function to set the font settings for the plot
15% - f_renew_plot: Closes any existing figures with the specified name and
16% then creates a new figure with the given name and properties. It returns
17% a 1x2 cell array containing the figure name and the figure handle.
18%
19% Variables
20% Loaded:
21% - None
22%
23% Initialized:
24% - layout: A tiled layout object for arranging plots within the figure
25% - diag_idx: Indices for the different parameter sets
26% - score_diag: Total scores for each parameter set
27% - title_texts: Different title texts based on the settings
28% - title_text: The chosen title text for the top plot
29% - label: Labels for the heatmap rows
30% - heatline: Data matrix for the heatmap
31% - h: A heatmap object
32%
33% Persistent:
34% - None
35
36%Font settings
37f_set_font_settings()
38
39% Inform the user that fig1 is being ploted
40disp("Plotting Scores")
41
42% Closes previous instances of the figure and generates a new one
43plots = f_renew_plot('Scores');
44
45layout = tiledlayout(5,1,'Padding','tight','TileSpacing','tight');
46
47% Generate top plot of Scores figure
48nexttile(layout,[1 1]);
49
50diag_idx = 1:numel(stg.pat);
51score_diag = [rst(stg.pat).st];
52
53% Plot the total scores of each parameter array to test
54scatter(diag_idx,score_diag,20,'filled')
55ylabel('Total Score (s_t)', 'FontSize', Axis_FontSize, 'FontWeight', Axis_Fontweight)
56set(gca,'xtick',[])
57% set(gca,'FontSize',10,'Fontweight','bold')
58
59% Choose correct title according to settings
60title_texts = ["Sum of the Score of all Experiments (s_t)",...
61    "Sum of the Log base 10 of the Score of each Experimental Output", ...
62    "Sum of the Log base 10 of the Score of each Experiment", ...
63    "Log base 10 of sum of the Score of all Experiments", ...
64    "Sum of the Score of all Experiments (s_t)"];
65title_text = title_texts(stg.useLog+1);
66title(title_text,...
67    "FontSize",Minor_title_FontSize,"FontWeight",Minor_title_Fontweight)
68
69% Choose the bounds for the x axis so it aligns with the bottom plot
70xlim([min(diag_idx)-0.5 max(diag_idx)+0.5])
71
72% Generate bottom plot of figure 1
73nexttile(layout,[4 1]);
74
75% Generate labels for left of heatmap (Experiment number Dataset number)
76label = arrayfun(@(n) strcat("E", num2str(n-1), " ", ...
77    strrep(string(sbtab.datasets(n).output_name), "_", "\_")), ...
78    stg.exprun, 'UniformOutput', false);
79label = horzcat(label{:});
80
81heatline = cell2mat(arrayfun(@(k) cell2mat(arrayfun(@(n) rst(k).sd(:, n)', ...
82    stg.exprun, 'UniformOutput', false))', stg.pat, 'UniformOutput', false));
83
84heatline( ~any(heatline,2), : ) = [];
85
86% Plot the heatmap
87h = heatmap(heatline,'Colormap',turbo,'YDisplayLabels',label,...
88    'GridVisible','off','FontSize',7);
89h.CellLabelFormat = '%.2e';
90
91h.Title = "\fontsize{10} \bf Score of each Experimental Output (s_d)";
92h.XLabel = '\fontsize{8} \bf Parameter sets (\theta)';
93h.YLabel = '\fontsize{8} \bf Experimental Outputs';
94end
Figure Inputs
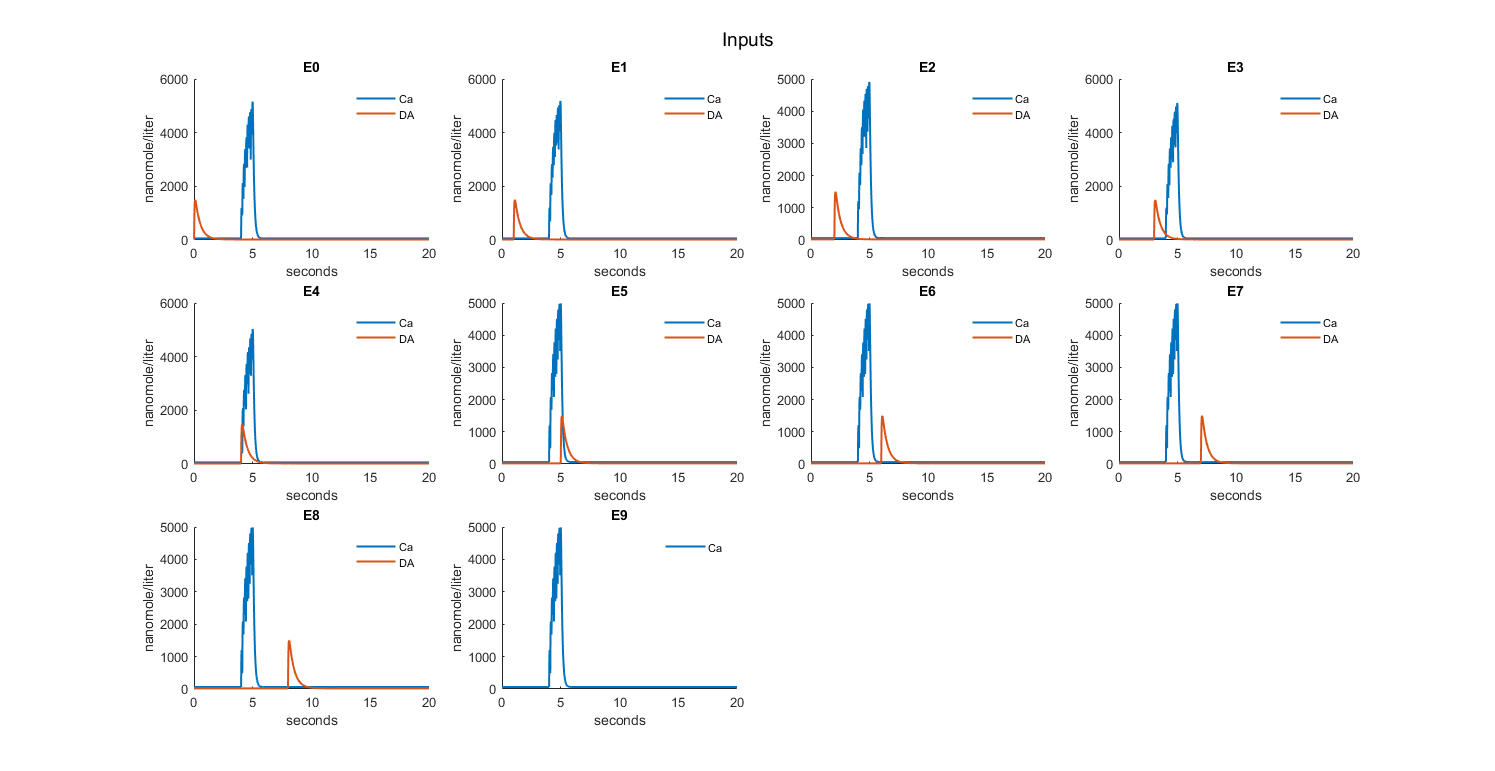
Checks inputs to the model
Code Figure Inputs
  1function plots = f_plot_inputs(rst,stg,sbtab)
  2% This function generates a figure containing a series of subplots, with
  3% each subplot representing the inputs of an individual experiment. The
  4% function also adjusts the layout and formatting of the figure according
  5% to the given font settings.
  6%
  7% Inputs:
  8% - rst: A structure containing the results of the experiments
  9% - stg: A structure containing experiment settings (e.g., exprun, pat)
 10% - sbtab: A structure containing datasets and their associated information
 11% - font_settings: A structure containing font settings for the plots
 12%
 13% Outputs:
 14% - plots: A cell array containing the generated plots
 15%
 16% Functions called:
 17% - set_font_settings: Apply font settings to the current function scope
 18% - f_get_subplot: Calculate subplot positions and generate figures
 19%
 20% Variables
 21% Loaded:
 22% None
 23%
 24% Initialized:
 25% - plot_n: Counter for the number of plots
 26% - fig_n: Counter for the number of figures
 27% - layout: The layout of the plots in the figure
 28% - plots_1: Temporary storage for the generated plots
 29% - labelfig2: Labels for each input in the experiment
 30% - Lgnd: Legend for the plots
 31%
 32% Persistent:
 33% None
 34
 35
 36% Inform the user that diagnosis inputs are beeing ploted
 37disp("Plotting Inputs")
 38
 39plot_n = 0;
 40fig_n = 0;
 41layout = [];
 42% plots_1 = [];
 43
 44% Set font settings
 45f_set_font_settings()
 46
 47% Iterate over the number of experiments
 48for n = stg.exprun
 49
 50    % Generate the right amount of figures for all plots and calculates
 51    % proper subploting position
 52    if mod(plot_n,12) == 0
 53        [fig_n,layout,plots(fig_n,:)] = f_get_subplot(size(stg.exprun,2),plot_n,fig_n,"Inputs",layout);
 54
 55        % Set figure name based on its order
 56        if fig_n > 1
 57            fig_name = "Inputs " + fig_n;
 58        else
 59            fig_name = "Inputs";
 60        end
 61        title(layout,fig_name,...
 62            'FontSize', Major_title_FontSize,'Fontweight',Major_title_Fontweight)
 63    end
 64
 65    nexttile(layout);
 66
 67    plot_n = plot_n +1;
 68
 69    hold on
 70
 71    % Iterate over the number of inputs in each experiment
 72    for j = 1:size(sbtab.datasets(n).input,2)
 73
 74        % Iterate over the number of parameter arrays to test
 75        for m = stg.pat
 76
 77            % (Until a non broken simulation is found)
 78            if rst(m).simd{1,n} ~= 0
 79
 80                % Plot the inputs to each experiment
 81                plot(rst(m).simd{1,n}.Time,rst(m).simd{1,n}.Data(1:end,...
 82                    str2double(strrep(sbtab.datasets(n).input(j),'S',''))+1),'LineWidth',line_width)
 83
 84                % Get the correct label for each input of the experiment
 85                labelfig2(j) = rst(m).simd{1,n}.DataNames(str2double(...
 86                    strrep(sbtab.datasets(n).input(j),'S',''))+1);
 87
 88                % Set y-axis label
 89                ylabel(layout,string(rst(m).simd{1,n}.DataInfo{...
 90                    str2double(strrep(sbtab.datasets(n).input(j),'S',''))+1,1}.Units),...
 91                    'FontSize', Axis_FontSize,'Fontweight',Axis_Fontweight)
 92
 93                break
 94            end
 95        end
 96    end
 97
 98    % Set x-axis label for the first plot in a row
 99    if mod(plot_n,12) == 1
100
101        xlabel(layout,"Seconds", 'FontSize', Axis_FontSize,'Fontweight',Axis_Fontweight)
102
103        % Create legend
104        Lgnd = legend(labelfig2,'Orientation','vertical', ...
105            'FontSize', Legend_FontSize,'Fontweight',Legend_Fontweight,...
106            'Location','layout','Box','off');
107        Lgnd.Layout.Tile = 'East';
108        Lgnd.ItemTokenSize = Legend_ItemTokenSize;
109    end
110
111    % Set y-axis limit and format
112    ylim([0 inf])
113    ytickformat('%-4.1f')
114
115    % Add a title to each plot
116    title("E"+(n-1))
117
118    hold off
119end
120end
Figure Outputs
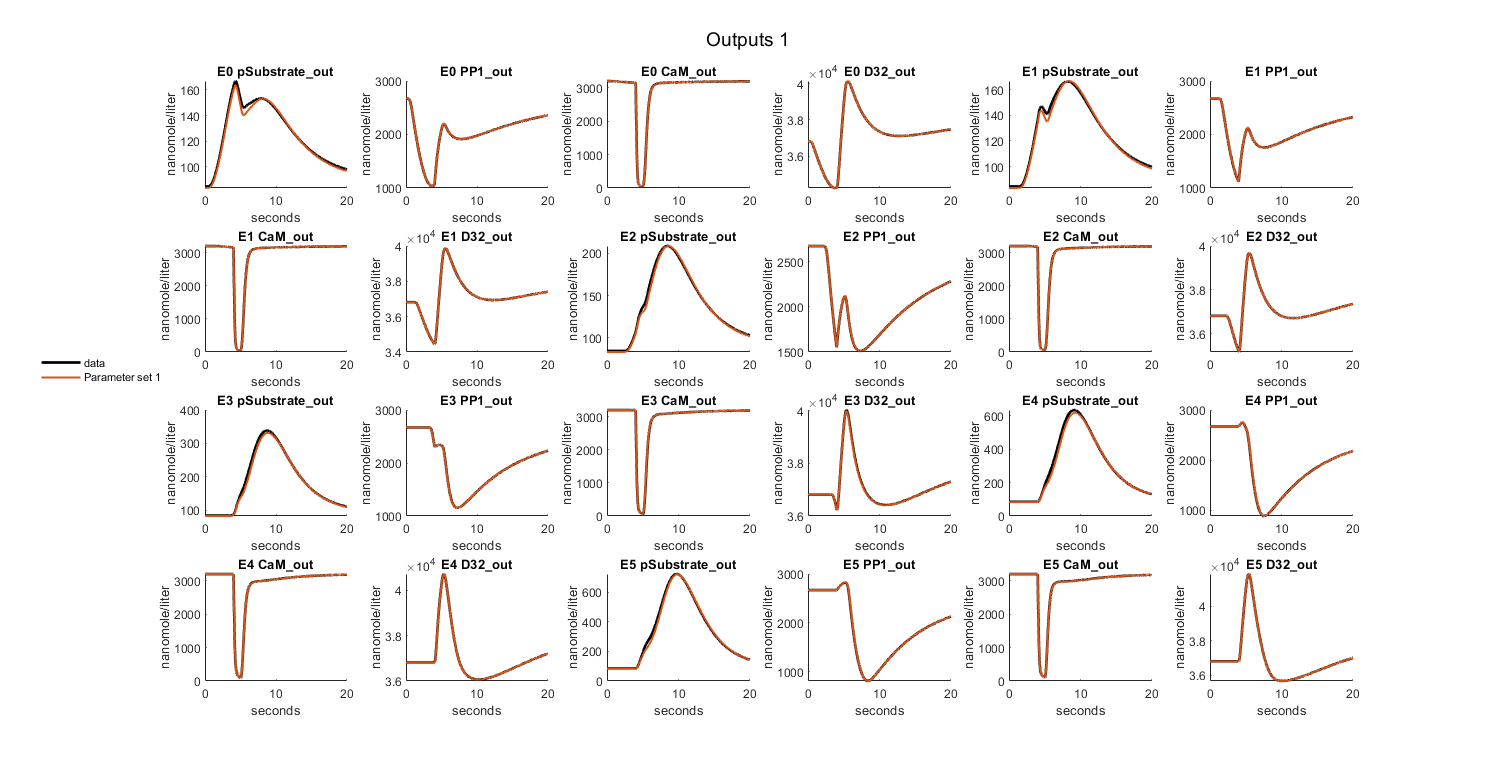
Expected outputs, observed outputs
Code Figure Outputs
  1function plots = f_plot_outputs(rst,stg,sbtab,Data,mmf)
  2% Generates a figure containing multiple subplots representing experimental
  3% outputs for each experiment and dataset. The function loops through each
  4% experiment and dataset and plots the results based on specified settings.
  5% The font properties for plot elements are set using the
  6% `set_font_settings` function.
  7%
  8% Inputs:
  9% - rst: Results object containing simulation results and data information
 10% - stg: Settings object containing various settings, such as experiment
 11% run and parameter array
 12% - sbtab: SBtab object containing datasets and output information
 13% - Data: Data object containing experimental data and error information
 14% - mmf: A flag to determine whether to normalize the simulation results
 15% - font_settings: A structure containing font properties for plot elements
 16%
 17% Outputs:
 18% - plots: A cell array containing figures and layouts generated
 19% by the function
 20%
 21% Functions called:
 22% - f_get_outputs: Get the total number of outputs to set the total number
 23% of plots
 24% - set_font_settings: Set the font properties for plot elements using the
 25% provided font_settings
 26% - f_get_subplot: Generate the required number of figures for all plots
 27% and calculate proper subplot positioning
 28% - f_error_area: Plot the error area
 29% - f_normalize: Normalize simulation results
 30%
 31% Variables:
 32% Loaded:
 33% None
 34%
 35% Initialized:
 36% - plot_tn: Total number of plots
 37% - plot_n: Current plot number
 38% - fig_n: Current figure number
 39% - layout: TiledLayout object for subplots
 40% - plots_1: Cell array to store figures and layouts temporarily
 41%
 42% Persistent:
 43% None
 44
 45% Display a message indicating that the outputs are being plotted
 46disp("Plotting Outputs")
 47
 48% Get the total number of outputs to set the total number of plots
 49[plot_tn,~] = f_get_outputs(stg,sbtab);
 50plot_n = 0;
 51fig_n = 0;
 52layout = [];
 53% plots_1 = [];
 54plots = cell(1,2);
 55plot_tn = plot_tn *2;
 56
 57% Set font settings using the provided font_settings
 58f_set_font_settings()
 59
 60% Loop through each experiment
 61for n = stg.exprun
 62
 63
 64
 65
 66    % Loop through each dataset in the current experiment
 67    for j = 1:size(sbtab.datasets(n).output,2)
 68
 69        for k = 1:2
 70        % Generate the required number of figures for all plots and calculate
 71        % proper subplot positioning
 72        if mod(plot_n,12) == 0
 73            [fig_n,layout,plots(fig_n,:)] =...
 74                f_get_subplot(plot_tn,plot_n,fig_n,"Outputs",layout);
 75
 76            if fig_n > 1
 77                fig_name = "Outputs " + fig_n;
 78            else
 79                fig_name = "Outputs";
 80            end
 81            title(layout,fig_name,...
 82                'FontSize', Major_title_FontSize,...
 83                'Fontweight',Major_title_Fontweight)
 84        end
 85
 86        nexttile(layout);
 87        plot_n = plot_n + 1;
 88
 89        hold on
 90
 91        error_area_plotted = false;
 92
 93        % Loop through each parameter array to test
 94        for m = stg.pat
 95
 96            % Plot only if the simulation was successful
 97            if rst(m).simd{1,n} ~= 0
 98
 99                data = Data(n).Experiment.x(:,j);
100
101                data_SD = Data(n).Experiment.x_SD(:,j);
102
103                time = rst(m).simd{1,n}.Time;
104
105                if k == 1
106                % Plot the error area if it hasn't been plotted yet
107                if ~error_area_plotted
108                    f_error_area(transpose(time), transpose([data-data_SD, data+data_SD]));
109                    error_area_plotted = true;
110                end
111                end
112                % Normalize simulation results
113                % [sim_results,~,sim_results] = f_normalize(rst(m),stg,n,j,mmf);
114                % sim_results_detailed =[];
115                if k == 1
116                    [sim_results,~,~] = f_normalize(rst(m),stg,n,j,mmf);
117                    sim_results_detailed =[];
118                else
119                    [~,~,sim_results] = f_normalize(rst(m),stg,n,j,mmf);
120                    sim_results_detailed =[];
121                end
122
123
124                % Plot detailed simulation results if enabled in settings
125                if stg.simdetail
126                    time_detailed = rst(m).simd{1,n+2*stg.expn}.Time;
127                    [~,sim_results_detailed]= f_normalize(rst(m),stg,n,j,mmf);
128
129                    plot(time_detailed,sim_results_detailed,'DisplayName',...
130                        string("\theta_"+m),'LineWidth',line_width)
131
132                else
133                    plot(time,sim_results,'DisplayName',...
134                        string("\theta_"+m),'LineWidth',line_width)
135                end
136
137                % Set the y-axis label
138                ylabel(string(rst(m).simd{1,n}.DataInfo{end-...
139                    size(sbtab.datasets(n).output,2)+j,1}.Units),...
140                    'FontSize', Axis_FontSize,'Fontweight',Axis_Fontweight)
141            end
142        end
143
144        hold off
145
146        % Set the y-axis limits
147        min_y = min([0, min(sim_results), min(data - data_SD), min(data),...
148            stg.simdetail * min(sim_results_detailed)]);
149        ylim([min_y, inf]);
150
151        % Choose the appropriate title based on the settings
152        if stg.plotoln == 1
153            title_text = "E" + (n-1) + " " +...
154                strrep(string(sbtab.datasets(n).output_name{1,j}),'_','\_');
155        else
156            title_text = "E" + (n-1) + " " +...
157                string(sbtab.datasets(n).output{1,j});
158        end
159
160        % Set the title for the subplot
161        title(title_text, 'FontSize', Minor_title_FontSize,...
162            'Fontweight', Minor_title_Fontweight);
163
164        % Set the number of decimal places for the y-axis
165        ytickformat('%-4.1f')
166        % Add a legend to the plot
167        if mod(plot_n,12) == 1
168
169            Lgnd = legend('show','Orientation','vertical',...
170                'FontSize', Legend_FontSize,'Fontweight',Legend_Fontweight,...
171                'Location','layout');
172            Lgnd.Layout.Tile = 'East';
173            Lgnd.ItemTokenSize = Legend_ItemTokenSize;
174            xlabel(layout,"Seconds",...
175                'FontSize', Axis_FontSize,'Fontweight',Axis_Fontweight)
176            % Remove the legend box
177            set(Lgnd,'Box','off')
178        end
179        end
180    end
181end
182end
Figure Input and Outputs per experiment
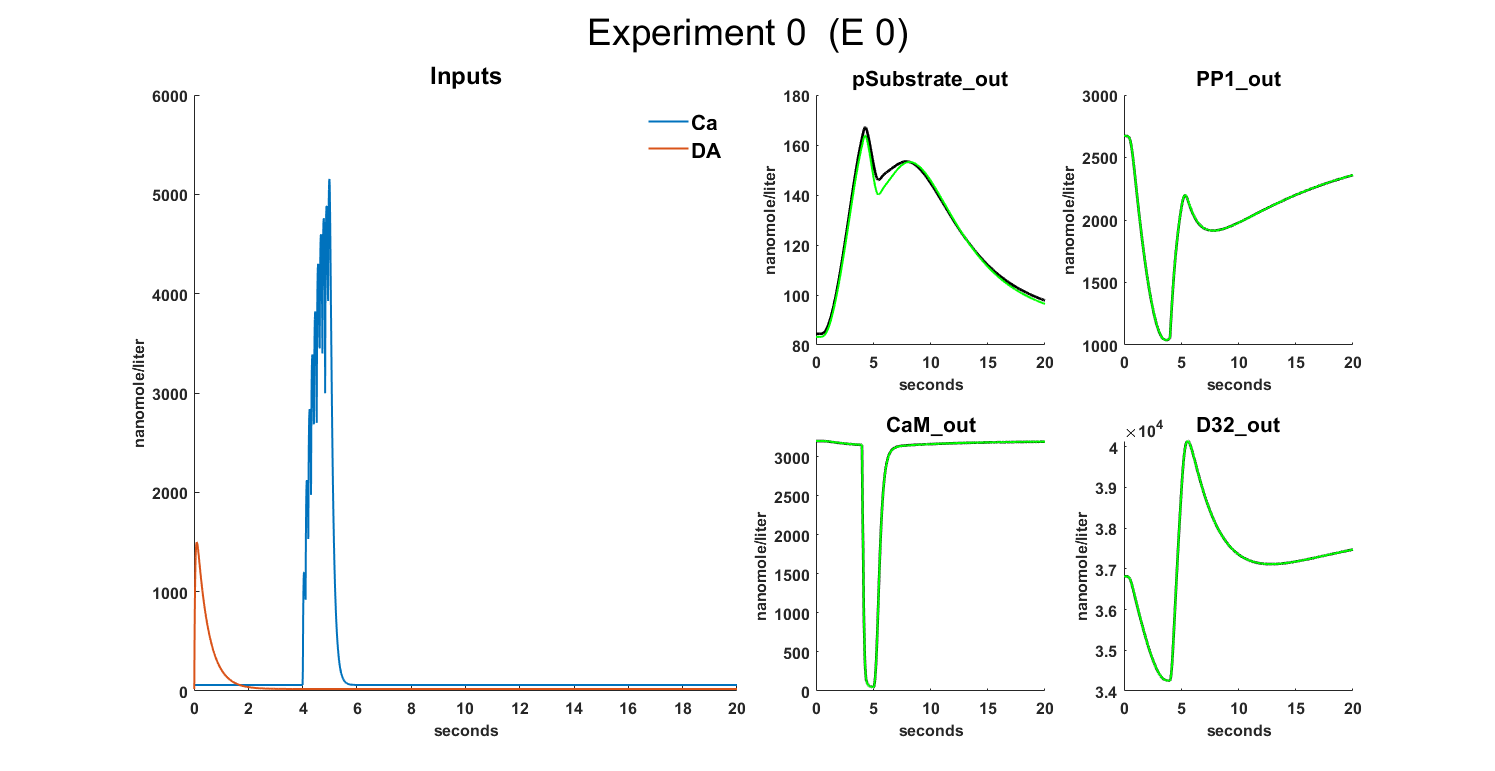
Combined figure of the inputs and outputs for each experiment, on the left side we have the inputs of the experiment and on the right side the outputs
Code Figure Input and Outputs
  1function plots = f_plot_in_out(rst,stg,sbtab,Data,mmf)
  2% This function generates a figure displaying input and output data for all
  3% experiments. The left side of the figure shows the inputs of the
  4% experiment, and the right side shows the outputs.
  5%
  6% Inputs:
  7% - rst: A structure containing the results of the simulations.
  8% - stg: A structure containing various settings for the experiments and
  9% simulations.
 10% - sbtab: A structure containing information about the input and output
 11% datasets.
 12% - Data: A structure containing experimental data and standard
 13% deviations.
 14% - mmf: A structure containing information about the model.
 15%
 16% Outputs:
 17% - plots: A cell array storing the names and figure handles of the
 18% generated plots.
 19%
 20% Used Functions :
 21% - f_plot_in_out_left: Plots the input data on the left side of the
 22% figure.
 23% - f_normalize: Normalizes the simulation results.
 24% - f_error_area: Plots the standard deviation of the output data as an
 25% error area.
 26% - f_set_font_settings: Sets font settings for the plot.
 27% - f_renew_plot: Closes any existing figures with the specified name and
 28% then creates a new figure with the given name and properties. It returns
 29% a 1x2 cell array containing the figure name and the figure handle.
 30%
 31% Variables
 32% Loaded:
 33% - time: Time array for simulations.
 34% - data: Experimental data array.
 35% - data_SD: Standard deviation array for experimental data.
 36%
 37% Initialized:
 38% - fig_number: Keeps track of the total number of figures generated.
 39% - fig_number_same_exp: Keeps track of the number of figures generated
 40% for the same experiment.
 41% - n_outputs_exp: The number of outputs for the current experiment.
 42% - layout: A tiled layout for the figure.
 43% - input_plot: A plot object for input data.
 44% - valid_outputs: A list of valid outputs.
 45% - valid_outputs_plots: A list of valid output plots.
 46% - line_width, Axis_FontSize, Axis_Fontweight, Minor_title_FontSize,
 47% Minor_title_Fontweight, Major_title_FontSize, Major_title_Fontweight,
 48% Minor_Title_Spacing, Legend_FontSize, Legend_Fontweight,
 49% Legend_ItemTokenSize: Font settings variables.
 50
 51
 52
 53% Display a message indicating that the inputs outputs are being plotted
 54disp("Plotting Inputs Outputs")
 55
 56% Set font settings for the plot
 57f_set_font_settings()
 58
 59% Initialize variables for plot management
 60fig_number = 0;
 61plots = cell(1,2);
 62
 63% Loop through each experiment run
 64for n = stg.exprun
 65
 66    % Get the number of outputs for the current experiment
 67    n_outputs_exp = size(sbtab.datasets(n).output,2);
 68
 69    % Initialize variables for plot management within the same experiment
 70    fig_number_same_exp = 1;
 71    fig_number =fig_number+ 1;
 72
 73    % Plot the left side of the figure with input data
 74    [layout,input_plot,plots] = ...
 75        f_plot_in_out_left(rst, stg, sbtab, fig_number_same_exp,...
 76        n_outputs_exp > 4, n, plots, fig_number);
 77
 78    % Loop through each output of the current experiment
 79    for j = 1:n_outputs_exp
 80
 81        % If the output number is greater than 4 times the figure number of
 82        % the same experiment, create a new layout for input data
 83        if j/4 > fig_number_same_exp
 84            fig_number_same_exp = fig_number_same_exp+1;
 85            fig_number = fig_number+ 1;
 86
 87            % Plot the left side of the figure with input data
 88            [layout,input_plot,plots] = ...
 89                f_plot_in_out_left(rst, stg,sbtab, fig_number_same_exp,...
 90                n_outputs_exp > 4, n, plots, fig_number);
 91        end
 92
 93        % Set up the layout for output data
 94        nexttile(layout,[1 1]);
 95        hold on
 96        valid_outputs = [];
 97
 98        % Loop through each parameter array to test
 99        for m = stg.pat
100
101            % Plot output data only if the simulation was successful
102            if rst(m).simd{1,n} ~= 0
103
104                % Retrieve time, data and standard deviation from the
105                % experiment
106                time = rst(m).simd{1,n}.Time;
107                data = Data(n).Experiment.x(:,j);
108                data_SD = Data(n).Experiment.x_SD(:,j);
109
110                % Plot the output data
111                plot_data = plot(time,data,'LineWidth',0.5,...
112                    'DisplayName','data','Color','k');
113
114                % Plot the standard deviation of the output data
115                plot_data_SD = f_error_area(transpose(time),...
116                    transpose([data-data_SD,data+data_SD]));
117                break
118            end
119        end
120
121        % Loop through each parameter array to test
122        for m = stg.pat
123
124            % Plot simulated output data only if the simulation was
125            % successful
126            if rst(m).simd{1,n} ~= 0
127
128                % Retrieve time and normalized simulation results
129                time = rst(m).simd{1,n}.Time;
130                [sim_results] = f_normalize(rst(m),stg,n,j,mmf);
131
132                % If simdetail is enabled, retrieve detailed time and
133                % simulation results
134                if stg.simdetail
135                    time_detailed = rst(m).simd{1,n+2*stg.expn}.Time;
136                    [~,sim_results_detailed] = ...
137                        f_normalize(rst(m),stg,n,j,mmf);
138                end
139
140                % Plot the outputs to each dataset (new subplots) and
141                % parameter array to test that are simulated using
142                % Simbiology
143
144                % Plot simulated output data
145                if stg.simdetail
146                    valid_outputs_plots(:,m) = plot(time_detailed,...
147                        sim_results_detailed,'DisplayName',...
148                        string("\theta_"+m),'LineWidth',line_width);
149                else
150                    valid_outputs_plots(:,m) = plot(time,...
151                        sim_results,...
152                        'DisplayName',string("\theta_"+m),...
153                        'LineWidth',line_width);
154                end
155
156                % Set ylabel with the correct units
157                ylabel(string(rst(m).simd{1,n}. ...
158                    DataInfo{end-n_outputs_exp+j,1}.Units),...
159                    'FontSize', Axis_FontSize,'Fontweight',Axis_Fontweight)
160                valid_outputs = [valid_outputs,m];
161            end
162
163        end
164
165        hold off
166
167        % Set ylim based on whether simdetail is enabled or not
168        if stg.simdetail
169            ylim([min([0,min(sim_results_detailed),min(sim_results),...
170                min(data-data_SD),min(data)]) inf])
171        else
172            ylim([min([0,min(sim_results),...
173                min(data-data_SD),min(data)]) inf])
174        end
175
176        % Set xlabel with correct font settings
177        xlabel('Seconds','FontSize', Axis_FontSize,...
178            'Fontweight',Axis_Fontweight)
179
180        % Set title according to settings
181        if stg.plotoln == 1
182            [~,t2] = ...
183                title(strrep(string(sbtab.datasets(n).output_name{1,j}),...
184                '_','\_')," ",'FontSize',Minor_title_FontSize,...
185                'Fontweight',Minor_title_Fontweight);
186        else
187            [~,t2] = ...
188                title(string(sbtab.datasets(n).output{1,j}),...
189                " ",'FontSize',Minor_title_FontSize,...
190                'Fontweight',Minor_title_Fontweight);
191        end
192
193        t2.FontSize = Minor_Title_Spacing;
194        % Set the number of decimal places for the y-axis
195        ytickformat('%-3.1f')
196        % Add a legend for the entire image
197        leg = ...
198            legend([input_plot,valid_outputs_plots(:,valid_outputs),...
199            plot_data,plot_data_SD],'FontSize', Legend_FontSize,...
200            'Fontweight',Legend_Fontweight,'Location',...
201            'layout',"Orientation","Horizontal");
202        leg.Layout.Tile = 'South';
203        leg.ItemTokenSize = Legend_ItemTokenSize;
204        set(leg,'Box','off')
205
206    end
207end
208end
209
210function [layout,input_plot,plots] = ...
211    f_plot_in_out_left(rst,stg,sbtab,fig_number_same_exp,reuse,n,...
212    plots,fig_number)
213% Function to plot input data on the left side of the figure
214
215% Set font settings for the plot
216f_set_font_settings()
217
218% Set figure names based on whether the same figure is reused or not
219if reuse
220    name_short = "E " + (n-1) + " " + fig_number_same_exp;
221    name_long = ...
222        "Experiment " + (n-1) + " " + fig_number_same_exp + "  (E " +...
223        (n-1) + " " + fig_number_same_exp +")";
224else
225    name_short = "E " + (n-1);
226    name_long = "Experiment " + (n-1) + "  (E " + (n-1) +")";
227end
228
229plots(fig_number,:) = f_renew_plot(name_short);
230
231% Create a tiled layout for the figure
232layout = tiledlayout(2,3,'Padding',"tight",'TileSpacing','tight');
233nexttile(layout,[2 1]);
234
235
236% Set title for the layout
237title(layout,name_long,...
238    'FontSize', Major_title_FontSize,'Fontweight',Major_title_Fontweight)
239
240hold on
241
242% Plot input data for each experiment
243for o = 1:size(sbtab.datasets(n).input,2)
244    for p = stg.pat
245
246        % (Until a non broken simulation is found)
247        if rst(p).simd{1,n} ~= 0
248            input_species_ID =...
249                str2double(strrep(sbtab.datasets(n).input(o),'S',''))+1;
250
251            % Plot the inputs to each experiment
252            input_plot = ...
253                plot(rst(p).simd{1,n}.Time,rst(p).simd{1,n}.Data(1:end,...
254                input_species_ID),'DisplayName',...
255                string(rst(p).simd{1,n}.DataNames(input_species_ID)),...
256                'LineWidth',line_width);
257
258            % Set ylabel with the correct units
259            ylabel(string(rst(p).simd{1,n}. ...
260                DataInfo{input_species_ID,1}.Units), ...
261                'FontSize', Axis_FontSize,'Fontweight',Axis_Fontweight)
262            break
263        end
264    end
265end
266
267% Set xlabel with correct font settings
268xlabel('Seconds','FontSize', Axis_FontSize,'Fontweight',Axis_Fontweight)
269ylim([0 inf])
270ytickformat('%-3.1f')
271
272% Add a title to the plot
273if size(sbtab.datasets(n).input,2) == 1
274[~,t4] = ...
275    title("Input"," ",'FontSize', Minor_title_FontSize,...
276    'Fontweight',Minor_title_Fontweight);
277else
278[~,t4] = ...
279    title("Inputs"," ",'FontSize', Minor_title_FontSize,...
280    'Fontweight',Minor_title_Fontweight);
281end
282t4.FontSize = Minor_Title_Spacing;
283
284hold off
285end
Figure Sensitivity Analysis \(S_{i}\)
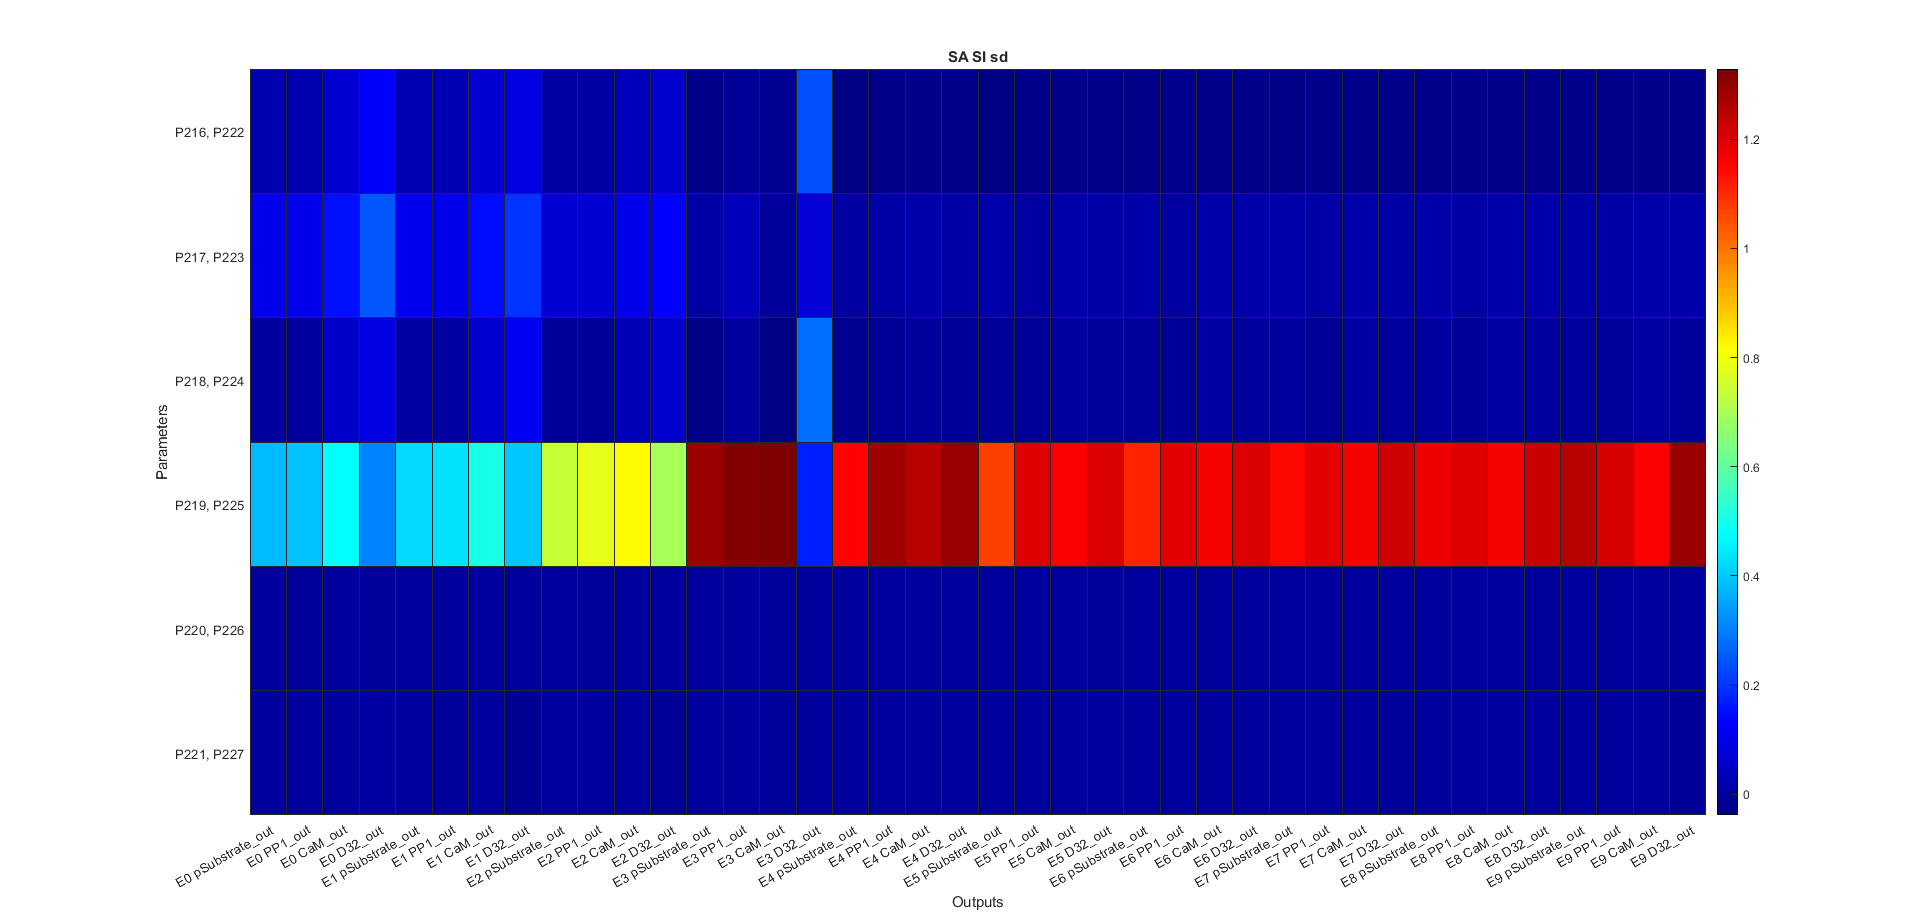
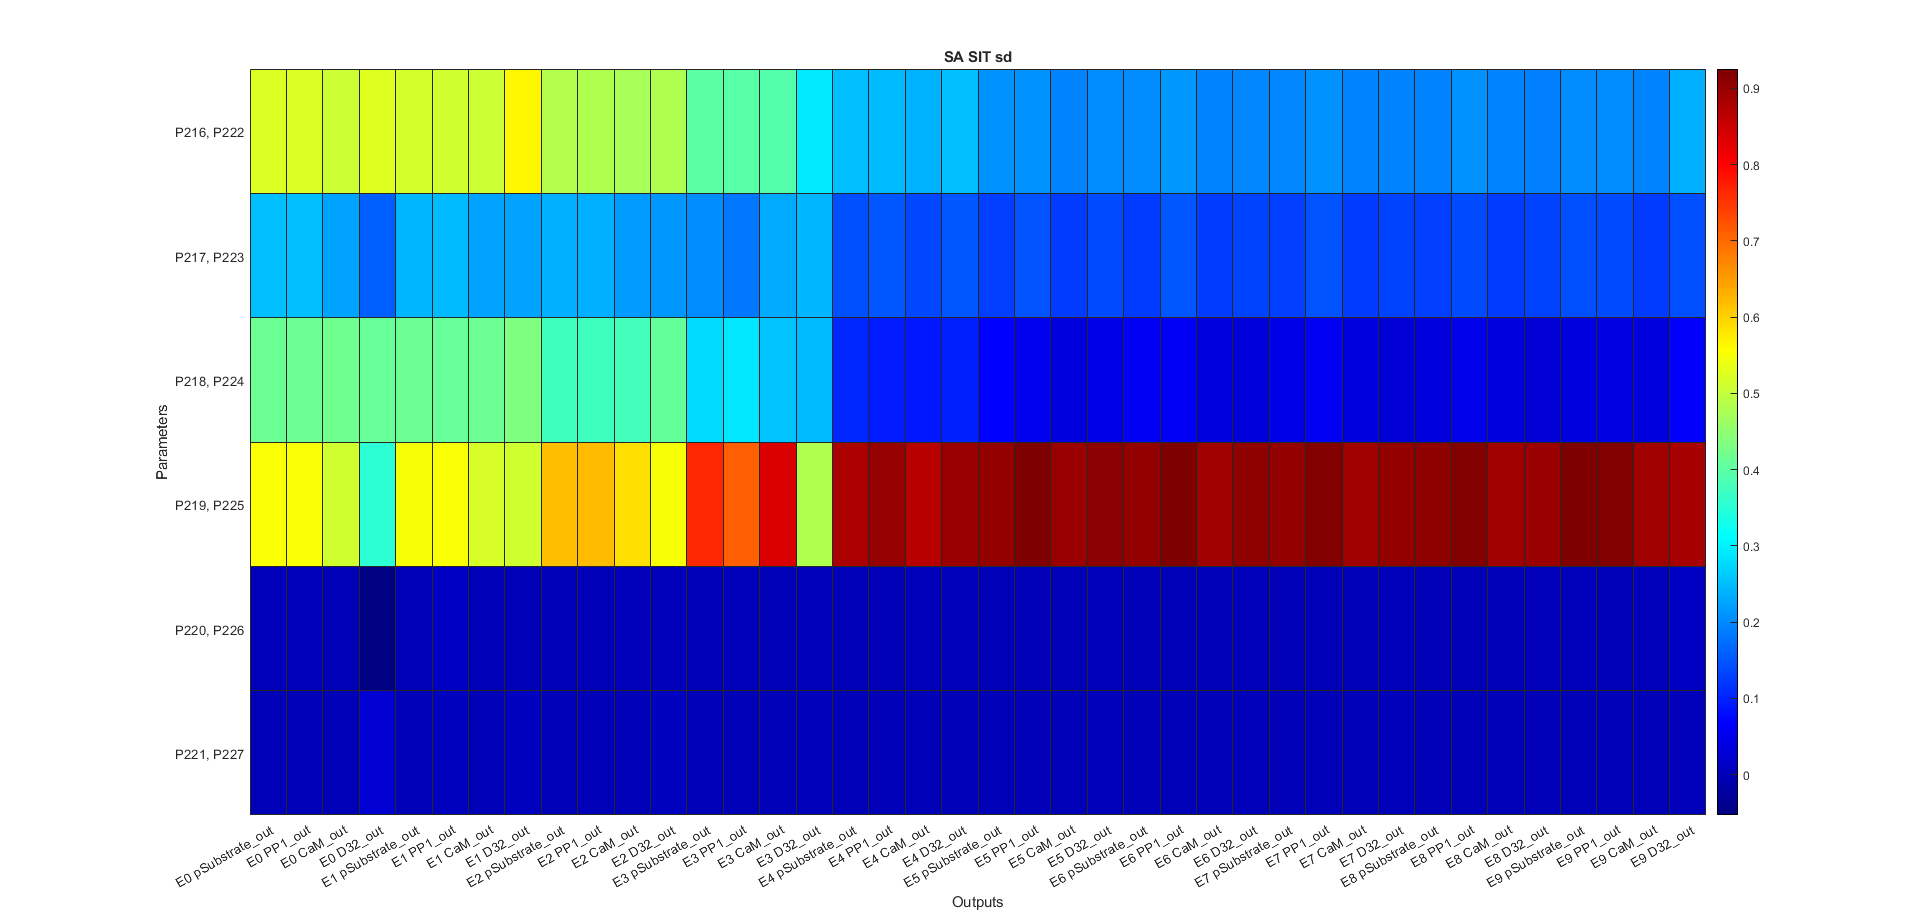
Figure Sensitivity Analysis \(S_{Ti}\)
Code figures SA
  1function plots = f_plot_gsa_sensitivities(results,settings,sbtab)
  2% This function creates plots for Global Sensitivity Analysis. It takes in
  3% results from sensitivity analysis, settings, an SBtab table, and font
  4% settings, then generates a set of plots for each section of the analysis.
  5% The function relies on three helper functions to generate heatmap plots,
  6% compute mean values, and set font settings.
  7%
  8% Inputs:
  9% - results: A structure containing the results from the sensitivity
 10%   analysis
 11% - settings: A structure containing various settings for the analysis
 12% - sbtab: An SBtab table used for creating the outputs
 13% - font_settings: A structure containing the font settings for the plots
 14%
 15% Outputs:
 16% - plots: A cell array containing the generated plots and their names
 17%
 18% Functions called:
 19% - f_generate_plot: Generates a heatmap plot for the given parameters
 20% - get_mean_values: Computes the mean values of an input matrix
 21% - set_font_settings: Sets font settings according to the provided
 22%   configuration
 23% - f_renew_plot: Closes any existing figures with the specified name and
 24% then creates a new figure with the given name and properties. It returns
 25% a 1x2 cell array containing the figure name and the figure handle.
 26%
 27% Variables:
 28% Loaded:
 29% None
 30%
 31% Initialized:
 32% - output_names2: Names of the outputs used in the plots
 33% - par_names: Names of the parameters used in the plots
 34% - par_names2: Modified names of the parameters used in the plots
 35% - plot_sections: Information about each plot section, including name,
 36% title, output_names2, and heatmap_values
 37%
 38% Persistent:
 39% None
 40
 41
 42
 43% Set font settings
 44f_set_font_settings()
 45
 46% Get the total number of outputs
 47[~,output_names.sd] = f_get_outputs(settings,sbtab);
 48
 49% Set output_names2 values
 50for n = 1:size(output_names.sd,2)
 51    output_names.sd{n}{:} = strrep(output_names.sd{n}{:},"_","\_");
 52end
 53for n = settings.exprun
 54    output_names.se{n} = "E " + string(n-1);
 55end
 56output_names.xfinal = output_names.sd;
 57
 58% Set parameter names
 59% par_names = cell(1,settings.parnum);
 60par_names2 = cell(1,settings.parnum);
 61par_names = "P_{" + [1:settings.parnum] + "}";
 62for n = 1:settings.parnum
 63    % par_names = n
 64    % par_names{n} = char("P_{" + find(settings.partest==n) + "}");
 65    par_names2{n} = string(par_names{n}(1,:));
 66    % Confirm if can be deleted
 67    % for m = 2:size(par_names{n},1)
 68    %     par_names2{n} = string(par_names2{n}) + ", " +...
 69    %         string(par_names{n}(m,:));
 70    % end
 71end
 72
 73% Define plot sections
 74plot_sections = {
 75    % Bootstrapping quartile mean of first order Sensitivity index for
 76    % score per Experimental Output
 77    "Si seo bm", ...
 78    ["First order Sensitivities",...
 79    "calculated using the Score of each Experimental Output",...
 80    "(Bootstrapping Mean)"],...
 81    "output_names.sd", "get_mean_values(results.SiQ.sd,settings)";
 82    % Bootstrapping quartile mean of total order Sensitivity index for
 83    % score per Experimental Output
 84    "SiT seo bm",...
 85    ["Total order Sensitivities",...
 86    " calculated using the Score of each Experimental Output ",...
 87    " (Bootstrapping Mean)"],...
 88    "output_names.sd", "get_mean_values(results.SiTQ.sd,settings)";
 89    % Bootstrapping quartile mean of first order Sensitivity index for
 90    % score per Experiments
 91    "Si se bm",...
 92    ["First order Sensitivities",...
 93    " calculated using the Score of each Experiment",...
 94    "(Bootstrapping Mean)"],...
 95    "output_names.se", "get_mean_values(results.SiQ.se,settings)";
 96    % Bootstrapping quartile mean of total order Sensitivity index for
 97    % score per Experiments
 98    "SiT se bm",...
 99    ["Total order Sensitivities",...
100    " calculated using the Score of each Experiment",...
101    "(Bootstrapping Mean)"],...
102    "output_names.se", "get_mean_values(results.SiTQ.se,settings)";
103    % Bootstrapping quartile mean of first order Sensitivity index for the
104    % final points of the simulations for the output beeing measured
105    "Si xfinal bm",...
106    ["First order Sensitivities",...
107    " calculated using the final value of each Experimental Output",...
108    "(Bootstrapping Mean)"],...
109    "output_names.xfinal", "get_mean_values(results.SiQ.xfinal,settings)"
110    % Bootstrapping quartile mean of total order Sensitivity index for the
111    % final points of the simulations for the output beeing measured
112    "SiT xfinal bm",...
113    ["Total order Sensitivities",...
114    " calculated using the final value of each Experimental Output",...
115    "(Bootstrapping Mean)"],...
116    "output_names.xfinal", "get_mean_values(results.SiTQ.xfinal,settings)"
117    };
118
119% Generate plots for each section
120for i = 1:size(plot_sections, 1)
121    [plots(i,:)] = f_generate_plot(results, settings, output_names,...
122        par_names2, plot_sections{i, 1}, plot_sections{i, 2},...
123        plot_sections{i, 3}, plot_sections{i, 4});
124end
125
126% Create Si, SiT plot
127plots(7,:) = f_renew_plot('Si,SiT');
128
129layout = tiledlayout(1,1,'Padding','compact','TileSpacing','tight');
130nexttile(layout)
131
132for n = 1:size(par_names2,2)
133    a{n} = char(par_names2{n});
134end
135
136a = categorical(a,a);
137
138bar(a,[transpose(results.Si.st(:,1:settings.parnum)),...
139    transpose(results.SiT.st(:,1:settings.parnum))])
140set(gca,'FontSize', Axis_FontSize);
141xlabel('Parameters','FontSize', Axis_FontSize,...
142    'Fontweight',Axis_Fontweight);
143ylabel('Sensitivity','FontSize', Axis_FontSize,...
144    'Fontweight',Axis_Fontweight);
145title(layout,...
146    'Sensitivities calculated using the sum of the Score of all Experiments',...
147    'FontSize',Major_title_FontSize,'Fontweight',Major_title_Fontweight);
148leg = legend({'Si','SiT'},'Location','best',...
149    'FontSize', Legend_FontSize,'Fontweight',Legend_Fontweight);
150leg.ItemTokenSize = Legend_ItemTokenSize;
151legend boxoff
152
153% Create Si, SiT bootstraping plot
154plots(8,:) = f_renew_plot('Si,SiT b');
155
156
157layout = tiledlayout(1,1,'Padding','compact','TileSpacing','tight');
158nexttile(layout)
159
160T = [];
161
162for n = 1:size(a,2)
163    for m = 1:size(results.SiQ.st(:,n),1)
164        T = [T;table(results.SiQ.st(m,n),a(n),"Si")];
165    end
166end
167for n = 1:size(a,2)
168    for m = 1:size(results.SiTQ.st(:,n),1)
169        T = [T;table(results.SiTQ.st(m,n),a(n),"SiT")];
170    end
171end
172
173boxchart(T.Var2,T.Var1,'GroupByColor',T.Var3,...
174    'MarkerStyle','.','JitterOutliers','on')
175set(gca,'FontSize', Axis_FontSize);
176xlabel('Parameters','FontSize',...
177    Axis_FontSize,'Fontweight',Axis_Fontweight);
178ylabel('Sensitivity','FontSize',...
179    Axis_FontSize,'Fontweight',Axis_Fontweight);
180title(layout,...
181    'Sensitivities calculated using the sum of the Score of all Experiments',...
182    'FontSize',Major_title_FontSize,'Fontweight',Major_title_Fontweight);
183
184subtitle(layout,'(Bootstrapping)','FontSize', Major_subtitle_FontSize,...
185    'Fontweight',Major_subtitle_Fontweight);
186leg = legend({'Si','SiT'},'Location','best',...
187    'FontSize', Legend_FontSize,'Fontweight',Legend_Fontweight);
188leg.ItemTokenSize = Legend_ItemTokenSize;
189legend boxoff
190end
191
192function [plots] =...
193    f_generate_plot(results,settings,output_names,par_names2,name,major_title,...
194    output_names_2,heatmap_values)
195% Function to generate heatmap plot for the given parameters
196
197% Set font settings
198f_set_font_settings()
199
200plots = f_renew_plot(name);
201
202layout = tiledlayout(1,1,'Padding','compact','TileSpacing','tight');
203nexttile(layout)
204
205fixed_output_names2 = eval(output_names_2);
206fixed_output_names2 =...
207    fixed_output_names2(~cellfun('isempty',fixed_output_names2));
208
209fixed_heatmap_values = eval(heatmap_values);
210fixed_heatmap_values =...
211    fixed_heatmap_values(:,all(~isnan(fixed_heatmap_values)));
212
213h = heatmap(fixed_output_names2,par_names2,...
214    fixed_heatmap_values,'Colormap',turbo,...
215    'ColorLimits',[0 1],'GridVisible','off',FontSize=Axis_FontSize);
216h.CellLabelFormat = '%.2f';
217
218title(layout,major_title(1),'FontSize', Major_title_FontSize,...
219    'Fontweight',Major_title_Fontweight);
220subtitle(layout,major_title(2:end),'FontSize', Major_subtitle_FontSize,...
221    'Fontweight',Major_subtitle_Fontweight)
222
223h.XLabel = '\fontsize{8} \bf Outputs';
224h.YLabel = '\fontsize{8} \bf Parameters';
225end
226
227function mean_values = get_mean_values(input_matrix,settings)
228% Function to compute the mean values of the input matrix
229
230mean_values = transpose(reshape(mean(input_matrix(:,:,1:settings.parnum)),...
231    [size(input_matrix,2),size(input_matrix,3)]));
232end
Calls
Loads - data.mat
f_get_subplot
Code
 1function [figure_number,layout,plots] =...
 2    f_get_subplot(plot_total_n,plot_n,figure_number,fig_name,layout,plots)
 3% Determines the layout for subplots, creates a new figure when needed, and
 4% closes previous instances of the figure.
 5%
 6% Inputs:
 7% - plot_total_n: Total number of plots to display
 8% - plot_n: Current plot number
 9% - figure_number: Current figure number
10% - fig_name: Figure name as a string
11% - layout: Layout object to be updated with new configuration
12% - plots: Cell array containing figure handles and names
13%
14% Outputs:
15% - figure_number: Updated figure number
16% - layout: Updated layout object
17% - plots: Updated cell array with figure handles and names
18%
19% Functions called:
20% - create_new_figure: Closes any existing figure with the same name,
21% then creates a new docked figure with the given name
22% - calculate_layout: Calculates the layout for the current figure based
23% on the figure number, total number of plots, maximum size, and subplot
24% dimensions
25% - f_renew_plot: Closes any existing figures with the specified name and
26% then creates a new figure with the given name and properties. It returns
27% a 1x2 cell array containing the figure name and the figure handle.
28%
29% Variables:
30% Loaded:
31% None
32%
33% Initialized:
34% - size_total: Maximum number of plots per figure
35% - size_x: Array of subplot layout column counts
36% - size_y: Array of subplot layout row counts
37%
38% Persistent:
39% None
40
41size_total = 12;
42
43size_x = [1,1,1,2,3,3,4,4,3,4,4,4];
44size_y = [1,2,3,2,2,2,2,2,3,3,3,3];
45
46if mod(plot_n,size_total) == 0
47    figure_number = figure_number + 1;
48    % If the total number of plots exceeds the maximum per figure, create
49    % additional figures and update the figure name.
50    if plot_total_n > size_total
51        fig_name = fig_name + " " + figure_number;
52    end
53
54    % Close previous instances of the figure and create a new one.
55    plots = f_renew_plot(fig_name);
56
57    % Calculate the layout for the current figure based on the total number
58    % of plots, maximum size, and the dimensions of the subplot.
59    layout =...
60        calculate_layout(figure_number, plot_total_n,...
61        size_total, size_x, size_y);
62end
63end
64
65function layout = ...
66    calculate_layout(figure_number, plot_total_n,...
67    size_total, size_x, size_y)
68% This function calculates the layout for the current figure based on the
69% figure number, total number of plots, maximum size, and subplot
70% dimensions.
71
72if figure_number <= floor(plot_total_n/size_total)
73    % If the current figure is not the last one, use the maximum size
74    % dimensions for the layout.
75    layout = tiledlayout(size_x(size_total), size_y(size_total),...
76        'Padding', 'none', 'TileSpacing', 'tight');
77else
78    % If the current figure is the last one, calculate the remaining number
79    % of plots and use the corresponding dimensions for the layout.
80    remaining_plots =...
81        plot_total_n - (floor(plot_total_n/size_total) * size_total);
82
83    layout =...
84        tiledlayout(size_x(remaining_plots), size_y(remaining_plots),...
85        'Padding', 'none', 'TileSpacing', 'tight');
86end
87end
Inputs
Outputs
Calls
Loads