Plots
f_plot
Code
 1function f_plot(rst,stg,mmf)
 2
 3% Inform the user that the plots are being done
 4disp("Plotting ...")
 5
 6data_model = mmf.model.data.data_model;
 7
 8% Import the data on the first run
 9load(data_model,'Data','sbtab')
10
11% Generate figure with Scores
12if isfield(rst,'diag')
13    f_plot_scores(rst.diag,stg,sbtab)
14end
15
16% Generate figure with Inputs
17if isfield(rst,'diag')
18    f_plot_inputs(rst.diag,stg,sbtab)
19end
20
21% Generate figure with Outputs
22if isfield(rst,'diag')
23    f_plot_outputs(rst.diag,stg,sbtab,Data,mmf)
24end
25
26% Generate figure with input and Output of all experiments
27if isfield(rst,'diag')
28    f_plot_in_out(rst.diag,stg,sbtab,Data)
29end
30
31% Generate figure with optimization results
32if isfield(rst,'opt')
33    f_plot_opt(rst,stg)
34end
35
36% Generate figures for Sensitivity Analysis
37if isfield(rst,'gsa')
38    f_plot_gsa_sensitivities(rst.gsa,stg,sbtab);
39end
40
41% Generate figure for Profile Likelihood Analysis
42if isfield(rst,'PLA')
43    f_plot_PL(rst,stg,mmf)
44end
45
46end
The function that calls all the custom plot functions when appropriate Plots diagnosis that are important to understand if everything is working as it was supposed, it , expected outputs, observed outputs and scores for the models and conditions specified.
Outputs
Figure Scores
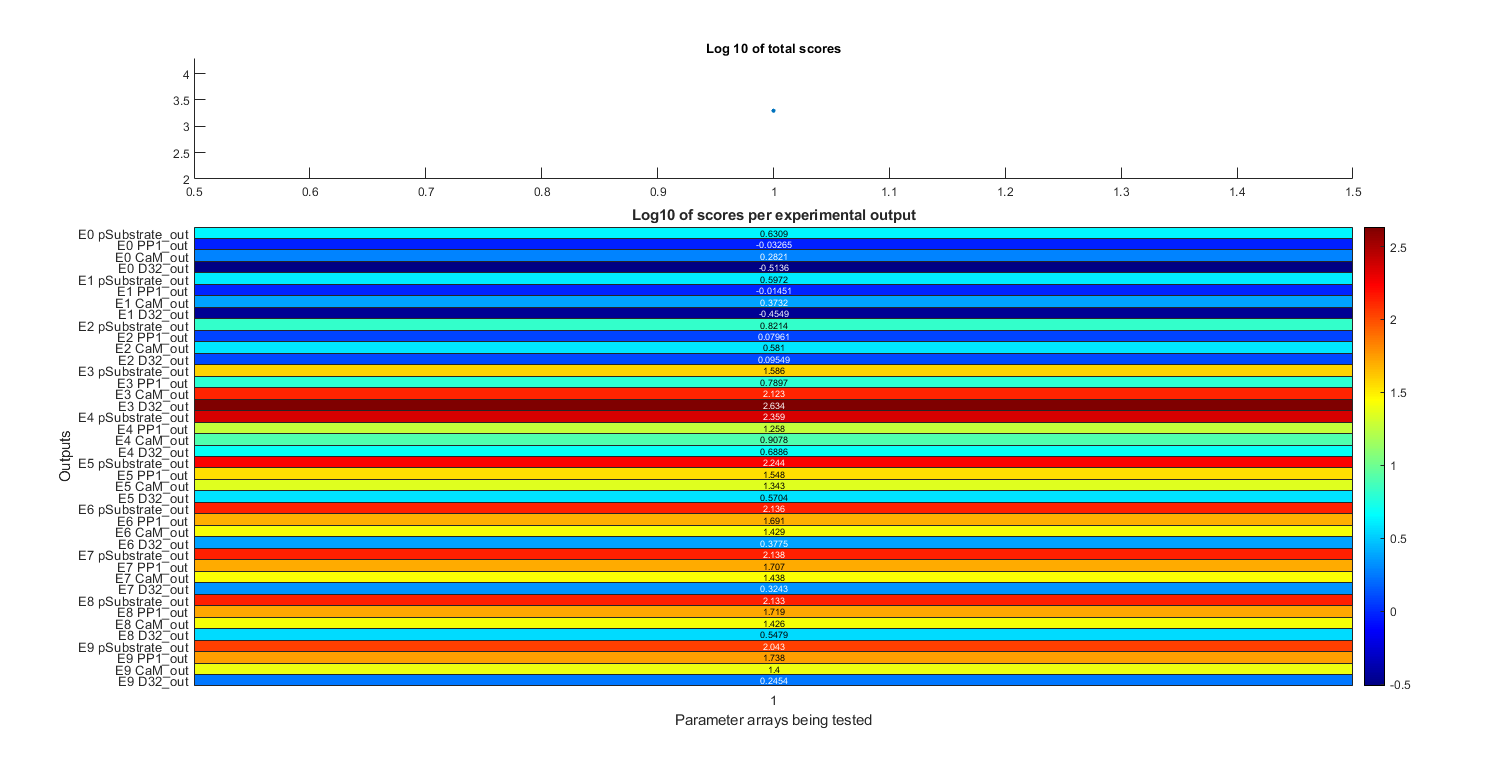
Total scores and scores per dataset given the parameters specified in stg.pa
Code Figure Scores
 1function f_plot_scores(rst,stg,sbtab)
 2set(0,'defaultTextFontName', 'Helvetica')
 3set(0,'defaultAxesFontName', 'Helvetica')
 4
 5% Generates a figure with Scores
 6
 7% Inform the user that fig1 is being ploted
 8disp("Plotting Scores")
 9
10%Closes previous instances of the figure and generates a new one
11figHandles = findobj('type', 'figure', 'name', 'Scores');
12close(figHandles);
13figure('WindowStyle', 'docked','Name','Scores','NumberTitle', 'off');
14
15% Generate top plot of figure 1
16subplot(4,1,1)
17
18% Plot the total scores of each parameter array to test
19scatter(stg.pat,[rst(stg.pat).st],20,'filled')
20ylabel('Total Score ($s_t$)')
21set(gca,'xtick',[])
22set(gca,'FontSize',10,'Fontweight','bold')
23
24% Choose correct title according to settings
25if stg.useLog == 1
26    title("Sum of the Log base 10 of the Score of each Experimental Output")
27elseif stg.useLog == 2
28    title("Sum of the Log base 10 of the Score of each Experiment")
29elseif stg.useLog == 3
30    title("Log base 10 of sum of the Score of all Experiments")
31elseif stg.useLog == 4 || stg.useLog == 0
32    title("Sum of the Score of all Experiments")
33end
34
35% Choose the bounds for the x axis so it aligns with the bottom plot
36xlim([min(stg.pat)-0.5 max(stg.pat)+0.5])
37
38% Generate bottom plot of figure 1
39subplot(4,1,[2,3,4])
40
41% Generate labels for left of heatmap (Experiment number Dataset number)
42label = [];
43
44% Iterate over the number of experiments
45for n = stg.exprun
46
47    % Iterate over the number of datasets in each experiment
48    for j = 1:size(sbtab.datasets(n).output,2)
49
50        label{size(label,2)+1} = {strrep("E" + (n-1) + " " + ...
51            string(sbtab.datasets(n).output_name{j}),"_","\_")};
52    end
53end
54% Choose wether to use the score of each dataset or its log base 10
55% according to settings
56% if stg.useLog == 1 || stg.useLog == 4
57heatline = [];
58
59% Iterate over the number of parameter arrays to test
60for k = stg.pat
61    heatpoint{k} = [];
62
63    % Iterate over the number of experiments
64    for n = stg.exprun
65
66        % Get the score of each dataset
67        heatpoint{k} = [heatpoint{k};rst(k).sd(:,n)];
68
69    end
70    % Combine heatpoints in order to correctly display heatmap
71    heatline = [heatline,heatpoint{k}];
72end
73heatline( ~any(heatline,2), : ) = [];
74
75% Plot the heatmap
76h = heatmap(heatline,'Colormap',turbo,'YDisplayLabels',label,...
77    'GridVisible','off','FontSize',10);
78h.CellLabelFormat = '%.2e';
79
80h.Title = "Score of each Experimental Output ($s_e$)";
81h.XLabel = 'Parameter arrays ($\theta$)';
82h.YLabel = 'Experimental Outputs';
83
84h.NodeChildren(3).XAxis.Label.Interpreter = 'latex';
85h.NodeChildren(3).YAxis.Label.Interpreter = 'latex';
86% h.NodeChildren(3).ZAxis.Label.Interpreter = 'latex';
87h.NodeChildren(3).Title.Interpreter = 'latex';
88h.NodeChildren(3).TickLabelInterpreter = 'latex';
89h.NodeChildren(2).TickLabelInterpreter = 'latex';
90% h.NodeChildren(1).TickLabelInterpreter = 'latex';
91% h.NodeChildren(1).Label.Interpreter = 'Latex';
92% h.NodeChildren(2).Label.Interpreter = 'Latex';
93
94end
Figure Inputs
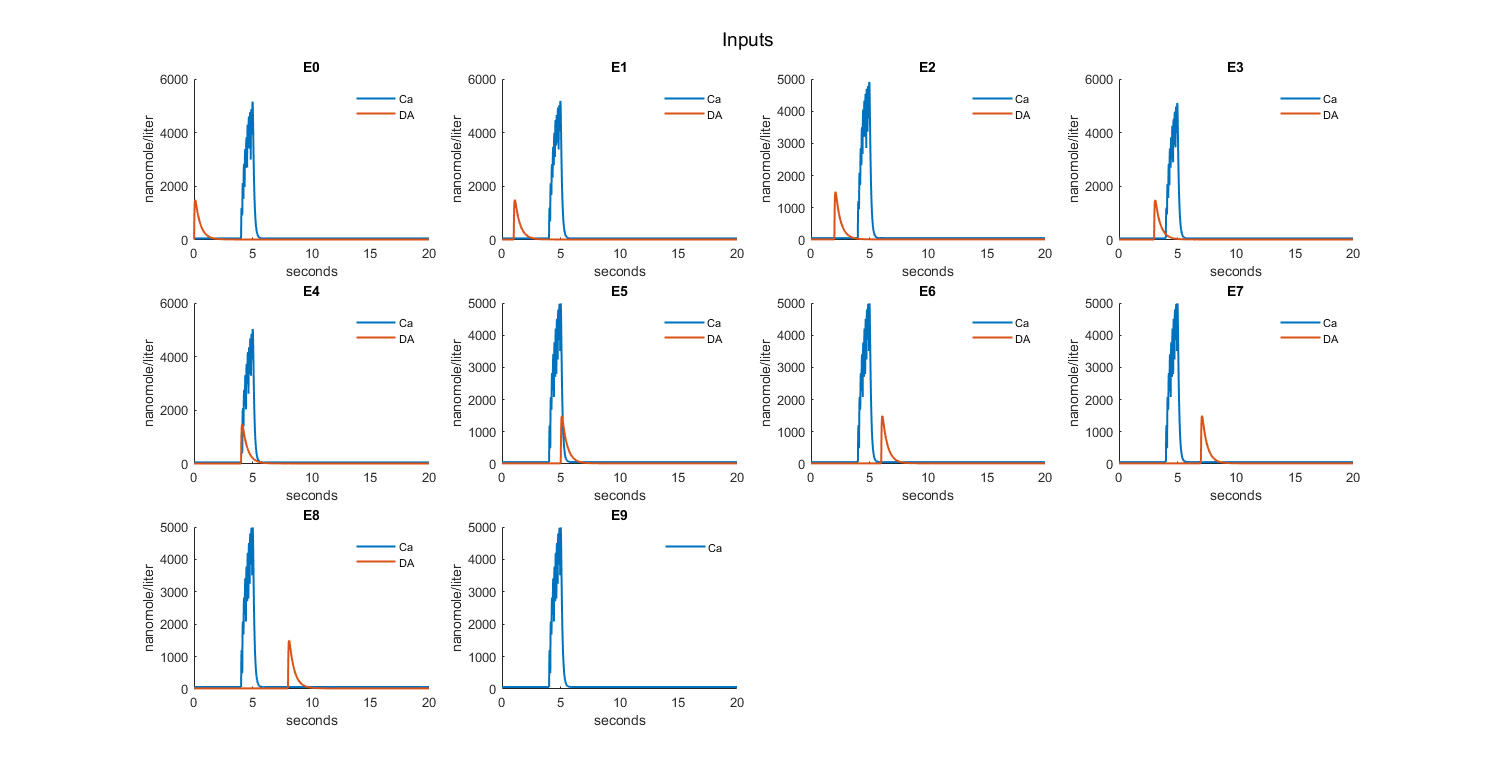
Checks inputs to the model
Code Figure Inputs
 1function f_plot_inputs(rst,stg,sbtab)
 2% Generates a figure with Inputs, one subplot per experiment
 3
 4% Inform the user that fig2 is being ploted
 5disp("Plotting Inputs")
 6
 7plot_n = 1;
 8fig_n = 0;
 9layout = [];
10% Iterate over the number of experiments
11for n = stg.exprun
12
13    % Generate the right amount of figures for all plots and calculates
14    % proper subploting position
15
16        [fig_n,layout] = f_get_subplot(size(stg.exprun,2),plot_n,fig_n,"Inputs",layout);
17    nexttile(layout);
18
19%     fig_n = f_get_subplot(size(stg.exprun,2),plot_n,fig_n,"Inputs");
20
21if mod(plot_n,24) == 1
22%             Lgnd = legend('show','Orientation','Horizontal');
23%             Lgnd.Position(1) = 0;
24%             Lgnd.Position(2) = 0.5;
25%             Lgnd.Layout.Tile = 'North';
26            xlabel(layout,"seconds", 'FontSize', 12,'Fontweight','bold','Interpreter','latex')
27%             ylabel(layout,string(rst(m).simd{1,n}.DataInfo{end-...
28%                     size(sbtab.datasets(n).output,2)+j,1}.Units), 'FontSize', 12,'Fontweight','bold')
29%             legend boxoff
30
31%             ylabel(string(rst(m).simd{1,n}.DataInfo{end-...
32%                     size(sbtab.datasets(n).output,2)+j,1}.Units))
33        end
34
35
36    plot_n = plot_n +1;
37
38    hold on
39
40    % Iterate over the number of inputs in each experiment
41    for j = 1:size(sbtab.datasets(n).input,2)
42
43        % Iterate over the number of parameter arrays to test
44        for m = stg.pat
45
46            % (Until a non broken simulation is found)
47            if rst(m).simd{1,n} ~= 0
48
49                % Plot the inputs to each experiment
50                plot(rst(m).simd{1,n}.Time,rst(m).simd{1,n}.Data(1:end,...
51                    str2double(strrep(sbtab.datasets(n).input(j),'S',''))+1),'LineWidth',1.5)
52
53                % Get the correct label for each input of the experiment
54                labelfig2(j) = rst(m).simd{1,n}.DataNames(str2double(...
55                    strrep(sbtab.datasets(n).input(j),'S',''))+1);
56
57                ylabel(layout,string(rst(m).simd{1,n}.DataInfo{...
58                    str2double(strrep(sbtab.datasets(n).input(j),'S',''))+1,1}.Units),...
59                    'FontSize', 12,'Fontweight','bold','Interpreter','latex')
60
61                break
62            end
63        end
64    end
65
66%     xlabel('seconds')
67    % Add a legend to each plot
68    legend(labelfig2)
69    legend boxoff
70    clear labelfig2
71
72    ylim([0 inf])
73
74    % Add a title to each plot
75    title("E"+(n-1))
76
77    hold off
78end
79
80end
Figure Outputs
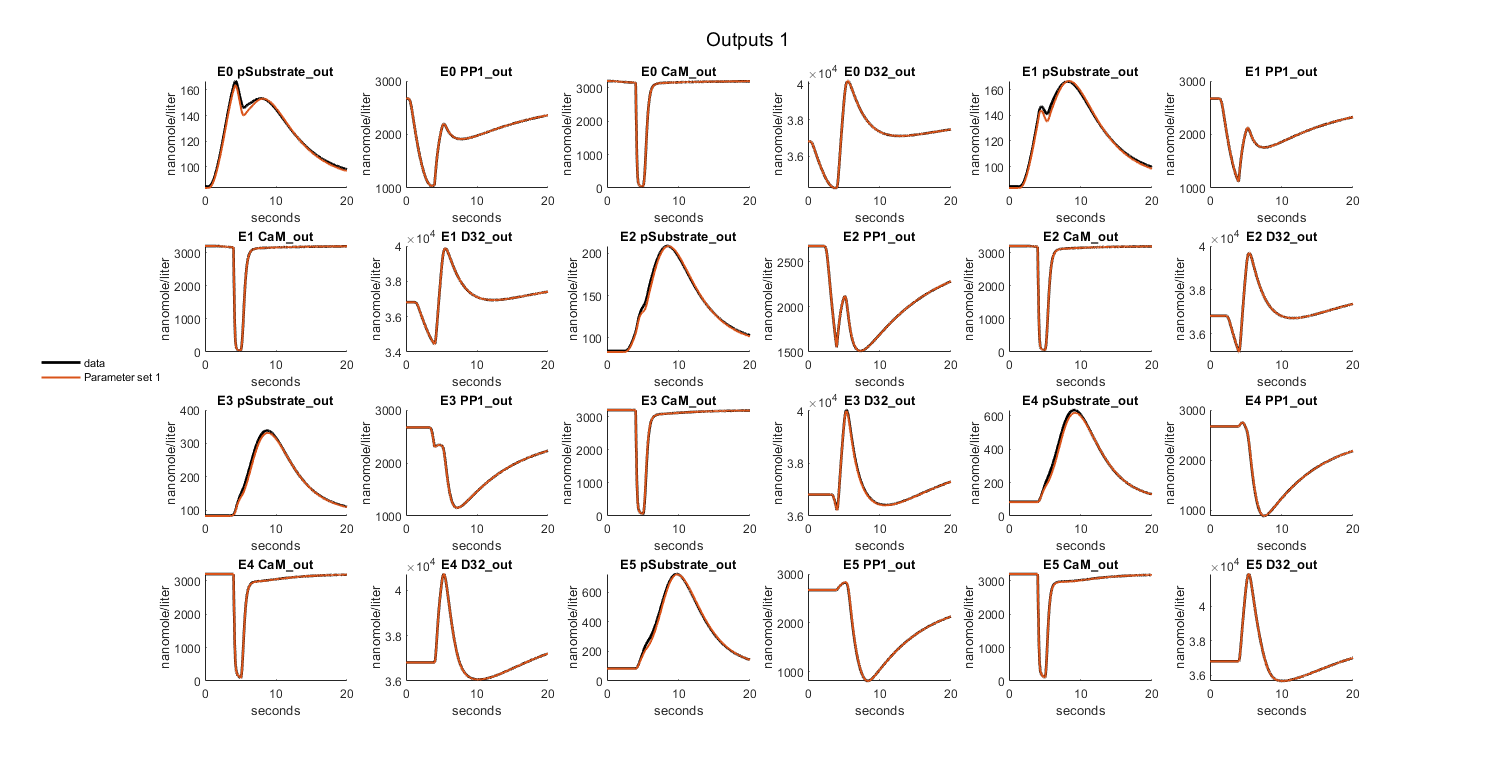
Expected outputs, observed outputs
Code Figure Outputs
  1function f_plot_outputs(rst,stg,sbtab,Data,mmf)
  2% Generates a figure with Outputs, one subplot per experimental output
  3
  4% Inform the user that fig3 is being ploted
  5disp("Plotting Outputs")
  6
  7% Get the total number of outputs to set the total number of plots
  8[plot_tn,~] = f_get_outputs(stg,sbtab);
  9plot_n = 1;
 10fig_n = 0;
 11layout = [];
 12% Iterate over the number of experiments
 13for n = stg.exprun
 14
 15    % Iterate over the number of datasets in each experiment
 16    for j = 1:size(sbtab.datasets(n).output,2)
 17
 18        % Generate the right amount of figures for all plots and calculates
 19        % proper subploting position
 20
 21                [fig_n,layout] = f_get_subplot(plot_tn,plot_n,fig_n,"Outputs",layout);
 22    nexttile(layout);
 23
 24%         fig_n = f_get_subplot(plot_tn,plot_n,fig_n,"Outputs");
 25
 26        % Add a legend to the figure
 27        if mod(plot_n,24) == 1
 28            Lgnd = legend('show','Orientation','Horizontal');
 29%             Lgnd.Position(1) = 0;
 30%             Lgnd.Position(2) = 0.5;
 31            Lgnd.Layout.Tile = 'North';
 32            xlabel(layout,"seconds", 'FontSize', 12,'Fontweight','bold','Interpreter','latex')
 33%             ylabel(layout,string(rst(m).simd{1,n}.DataInfo{end-...
 34%                     size(sbtab.datasets(n).output,2)+j,1}.Units), 'FontSize', 12,'Fontweight','bold')
 35            legend boxoff
 36
 37%             ylabel(string(rst(m).simd{1,n}.DataInfo{end-...
 38%                     size(sbtab.datasets(n).output,2)+j,1}.Units))
 39        end
 40
 41        plot_n = plot_n + 1;
 42
 43        hold on
 44
 45        % Iterate over the number of parameter arrays to test
 46        for m = stg.pat
 47            % (Until a non broken simulation is found)
 48            if rst(m).simd{1,n} ~= 0
 49
 50                time = rst(m).simd{1,n}.Time;
 51                data = Data(n).Experiment.x(:,j);
 52
 53                data_SD = Data(n).Experiment.x_SD(:,j);
 54
 55                % Plot the outputs to each dataset (new subplots) as they
 56                % are given in the data provided in sbtab
 57%                 scatter(time,data,'filled','k',...
 58%                     'DisplayName','data')
 59
 60                errorbar(time,data,data_SD,'ok','LineWidth',0.5,'MarkerSize',1,'DisplayName',"test");
 61
 62                break
 63            end
 64        end
 65
 66        % Iterate over the number of parameter arrays to test
 67        for m = stg.pat
 68
 69            % Plot only if the simulation was successful
 70            if rst(m).simd{1,n} ~= 0
 71
 72                time = rst(m).simd{1,n}.Time;
 73                [sim_results,~] = f_normalize(rst(m),stg,n,j,mmf);
 74                if stg.simdetail
 75                    time_detailed = rst(m).simd{1,n+2*stg.expn}.Time;
 76                    [~,sim_results_detailed]= f_normalize(rst(m),stg,n,j,mmf);
 77                end
 78
 79                % Plot the outputs to each dataset (new subplots) and
 80                % parameter array to test that are simulated using
 81                % Simbiology
 82                if stg.simdetail
 83                    plot(time_detailed,...
 84                        sim_results_detailed,'DisplayName',...
 85                        string("$\theta_"+m + "$"),'LineWidth',1.5)
 86                else
 87
 88                    plot(time,...
 89                        sim_results,'DisplayName',...
 90                        string("$\theta_"+m + "$"),'LineWidth',1.5)
 91                end
 92
 93%                 ylabel(string(rst(m).simd{1,n}.DataInfo{end-...
 94%                     size(sbtab.datasets(n).output,2)+j,1}.Units))
 95
 96                ylabel(layout,string(rst(m).simd{1,n}.DataInfo{end-...
 97                    size(sbtab.datasets(n).output,2)+j,1}.Units), 'FontSize', 12,'Fontweight','bold','Interpreter','latex')
 98            end
 99        end
100
101        hold off
102
103%         xlabel('seconds')
104
105        if stg.simdetail
106            ylim([min([0,min(sim_results_detailed),min(sim_results),min(data-data_SD),min(data)]) inf])
107        else
108            ylim([min([0,min(sim_results),min(data-data_SD),min(data)]) inf])
109        end
110
111        % Choose correct title according to settings
112        if stg.plotoln == 1
113            title("E" + (n-1) + " " +...
114                strrep(string(sbtab.datasets(n).output_name{1,j}),'_','\_'))
115        else
116            title("E" + (n-1) + " " +...
117                string(sbtab.datasets(n).output{1,j}))
118        end
119
120        % Choose number of decimal places for y axis
121        ytickformat('%.2g')
122    end
123end
124end
Figure Input and Outputs per experiment

Combined figure of the inputs and outputs for each experiment, on the left side we have the inputs of the experiment and on the right side the outputs
Code Figure Input and Outputs
  1function f_plot_in_out(rst,stg,sbtab,Data)
  2% Generates a figure with input and Output of all experiments on the left
  3% side it plots the inputs of the experiment and on the right side it plots
  4% the outputs
  5
  6for n = stg.exprun
  7
  8    helper = 1;
  9    f_plot_in_out_left(rst,stg,sbtab,helper,...
 10        size(sbtab.datasets(n).output,2) > 4)
 11
 12    for j = 1:size(sbtab.datasets(n).output,2)
 13
 14        if j/4 > helper
 15            helper = helper +1;
 16            f_plot_in_out_left(rst,stg,sbtab,helper,...
 17                size(sbtab.datasets(n).output,2) > 4)
 18        end
 19
 20        if size(sbtab.datasets(n).output,2) == 1
 21            subplot(1,2,j+ceil(j/(2/2))*1)
 22        elseif size(sbtab.datasets(n).output,2) == 2
 23            subplot(2,2,j+ceil(j/(2/2))*1)
 24        elseif size(sbtab.datasets(n).output,2) > 2 &&...
 25                size(sbtab.datasets(n).output,2) <= 4
 26            subplot(2,4,j+ceil(j/(4/2))*2)
 27        elseif size(sbtab.datasets(n).output,2) > 4
 28            subplot(2,4,j+ceil(j/(4/2))*2-helper*8+8)
 29        end
 30
 31        hold on
 32
 33        % Iterate over the number of parameter arrays to test
 34        for m = stg.pat
 35            % (Until a non broken simulation is found)
 36            if rst(m).simd{1,n} ~= 0
 37
 38                % Plot the outputs to each dataset (new subplots) as they
 39                % are given in the data provided in sbtab
 40
 41                time = rst(m).simd{1,n}.Time;
 42                data = Data(n).Experiment.x(:,j);
 43                data_SD = Data(n).Experiment.x_SD(:,j);
 44
 45                scatter(time,data,'filled','k',...
 46                    'DisplayName','data')
 47
 48                errorbar(time,data,data_SD, 'vertical',	'k', 'LineStyle', 'none','LineWidth',1);
 49                break
 50            end
 51        end
 52        % Iterate over the number of parameter arrays to test
 53        for m = stg.pat
 54
 55            % Plot only if the simulation was successful
 56            if rst(m).simd{1,n} ~= 0
 57
 58                time = rst(m).simd{1,n}.Time;
 59                [sim_results] = f_normalize(rst(m),stg,n,j);
 60
 61
 62                if stg.simdetail
 63                    time_detailed = rst(m).simd{1,n+2*stg.expn}.Time;
 64                    [~,sim_results_detailed]= f_normalize(rst(m),stg,n,j);
 65                end
 66
 67                % Plot the outputs to each dataset (new subplots) and
 68                % parameter array to test that are simulated using
 69                % Simbiology
 70                if stg.simdetail
 71                    plot(time_detailed,...
 72                        sim_results_detailed,'DisplayName',...
 73                        string("Parameter set "+m),'LineWidth',1.5)
 74                else
 75                    plot(time,...
 76                        sim_results,...
 77                        'DisplayName',string("Parameter set "+m),...
 78                        'LineWidth',1.5)
 79                end
 80
 81                ylabel(string(rst(m).simd{1,n}.DataInfo{end-...
 82                    size(sbtab.datasets(n).output,2)+j,1}.Units),...
 83                    'FontSize', 12,'Fontweight','bold')
 84            end
 85        end
 86
 87        hold off
 88
 89        set(gca,'FontSize',12,'Fontweight','bold')
 90
 91        if stg.simdetail
 92            ylim([min([0,min(sim_results_detailed),min(sim_results),min(data-data_SD),min(data)]) inf])
 93        else
 94            ylim([min([0,min(sim_results),min(data-data_SD),min(data)]) inf])
 95        end
 96
 97        xlabel('seconds','FontSize', 12,'Fontweight','bold')
 98
 99        % Choose correct title according to settings
100        if stg.plotoln == 1
101            title(strrep(string(sbtab.datasets(n).output_name{1,j}),'_',...
102                '\_'),'FontSize', 16,'Fontweight','bold')
103        else
104            title(string(sbtab.datasets(n).output{1,j}),'FontSize', 16,...
105                'Fontweight','bold')
106        end
107
108        % Choose number of decimal places for y axis
109        ytickformat('%.2g')
110    end
111end
112
113    function f_plot_in_out_left(rst,stg,sbtab,helper,reuse)
114        if reuse
115            figHandles = findobj('type', 'figure', 'name', "E " + (n-1) +...
116                " " + helper);
117            close(figHandles);
118            figure('WindowStyle', 'docked','Name', "E " + (n-1)+ " " +...
119                helper,'NumberTitle', 'off');
120            sgtitle( "Experiment " + (n-1) + " " + helper + "  (E " +...
121                (n-1) + " " + helper +")",'FontSize', 28);
122        else
123            figHandles = findobj('type', 'figure', 'name', "E " + (n-1));
124            close(figHandles);
125            figure('WindowStyle', 'docked','Name', "E " + (n-1),...
126                'NumberTitle', 'off');
127            sgtitle( "Experiment " + (n-1) + "  (E " + (n-1) +...
128                ")",'FontSize', 28);
129        end
130
131        subplot(2,4,[1,2,5,6])
132
133        hold on
134        for o = 1:size(sbtab.datasets(n).input,2)
135            for p = stg.pat
136
137                % (Until a non broken simulation is found)
138                if rst(p).simd{1,n} ~= 0
139                    % Plot the inputs to each experiment
140                    plot(rst(p).simd{1,n}.Time,rst(p).simd{1,n}.Data(1:end,...
141                        str2double(strrep(sbtab.datasets(n).input(o),'S','')...
142                        )+1),'LineWidth',1.5)
143
144                    % Get the correct label for each input of the
145                    % experiment
146                    labelfig2(o) = rst(p).simd{1,n}.DataNames(str2double(...
147                        strrep(sbtab.datasets(n).input(o),'S',''))+1);
148
149                    ylabel(string(rst(p).simd{1,n}.DataInfo{...
150                        str2double(strrep(sbtab.datasets(n).input(o),'S',''))+1,1}.Units),...
151                        'FontSize', 12,'Fontweight','bold')
152
153
154                    break
155                end
156            end
157
158        end
159
160        set(gca,'FontSize',12,'Fontweight','bold')
161
162        xlabel('seconds','FontSize', 12,'Fontweight','bold')
163        % Add a legend to each plot
164        legend(labelfig2,'FontSize', 16,'Fontweight','bold')
165        legend boxoff
166        clear labelfig2
167
168        ylim([0 inf])
169
170        % Add a title to each plot
171        title("Inputs",'FontSize', 18,'Fontweight','bold')
172
173        hold off
174    end
175end
Figure Sensitivity Analysis \(S_{i}\)
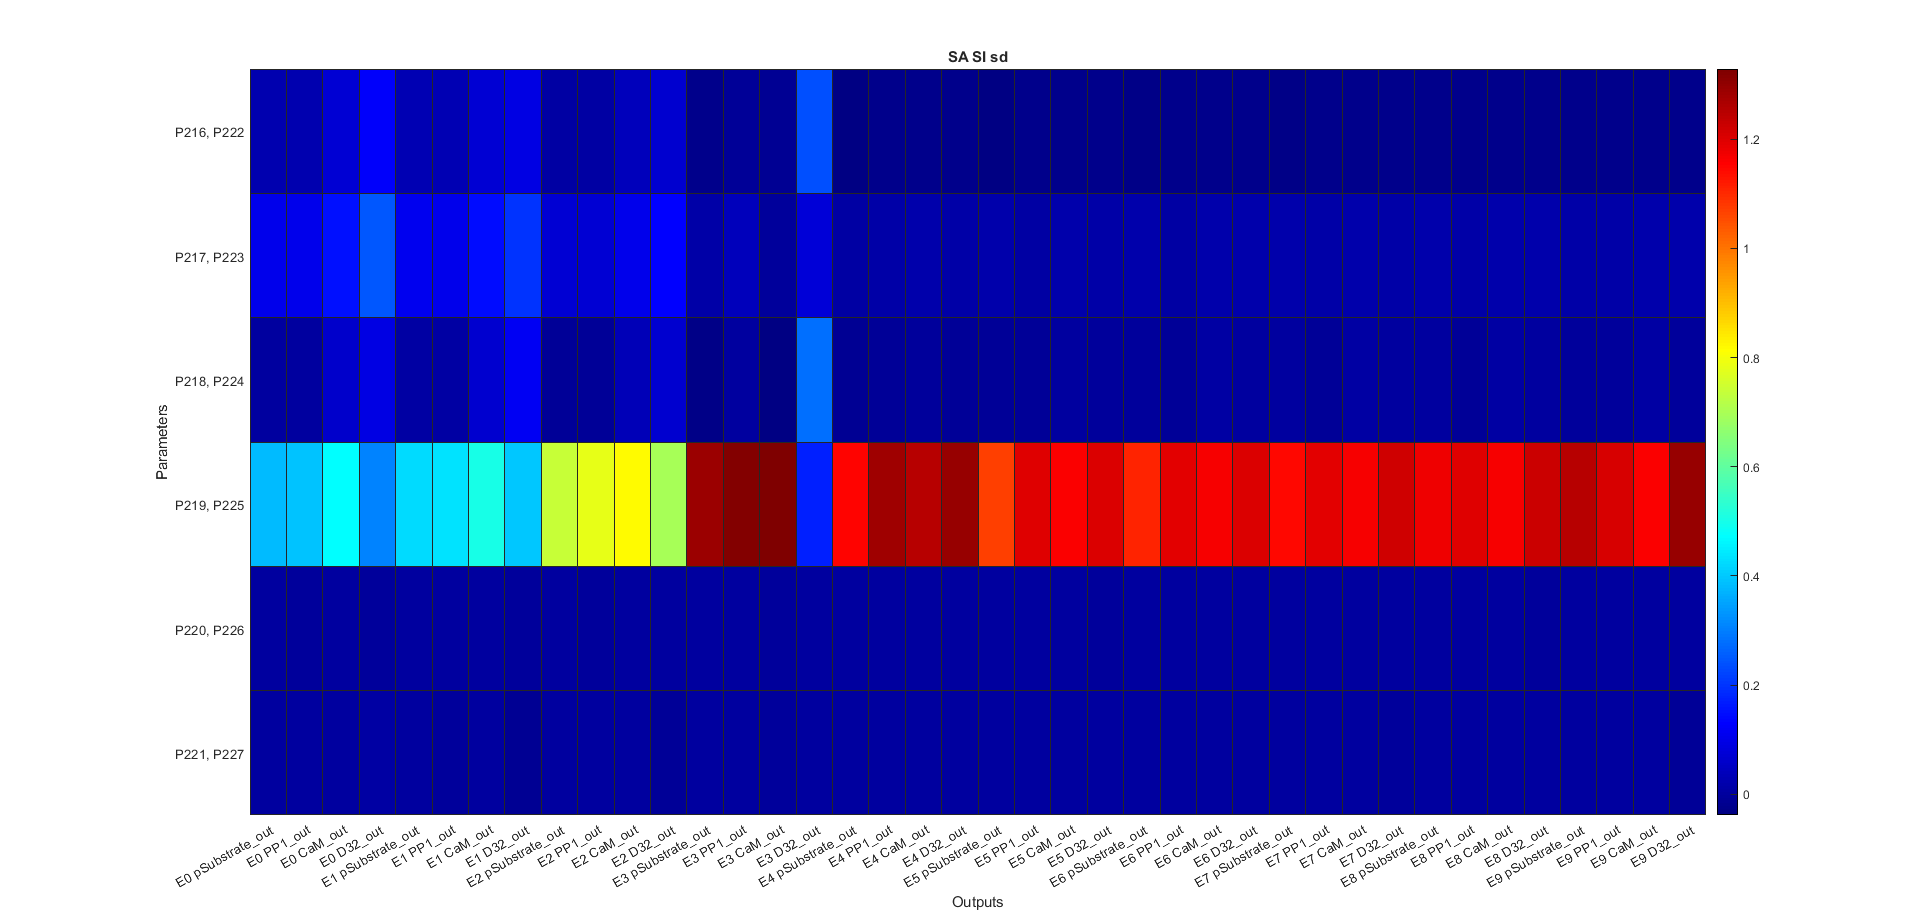
Figure Sensitivity Analysis \(S_{Ti}\)
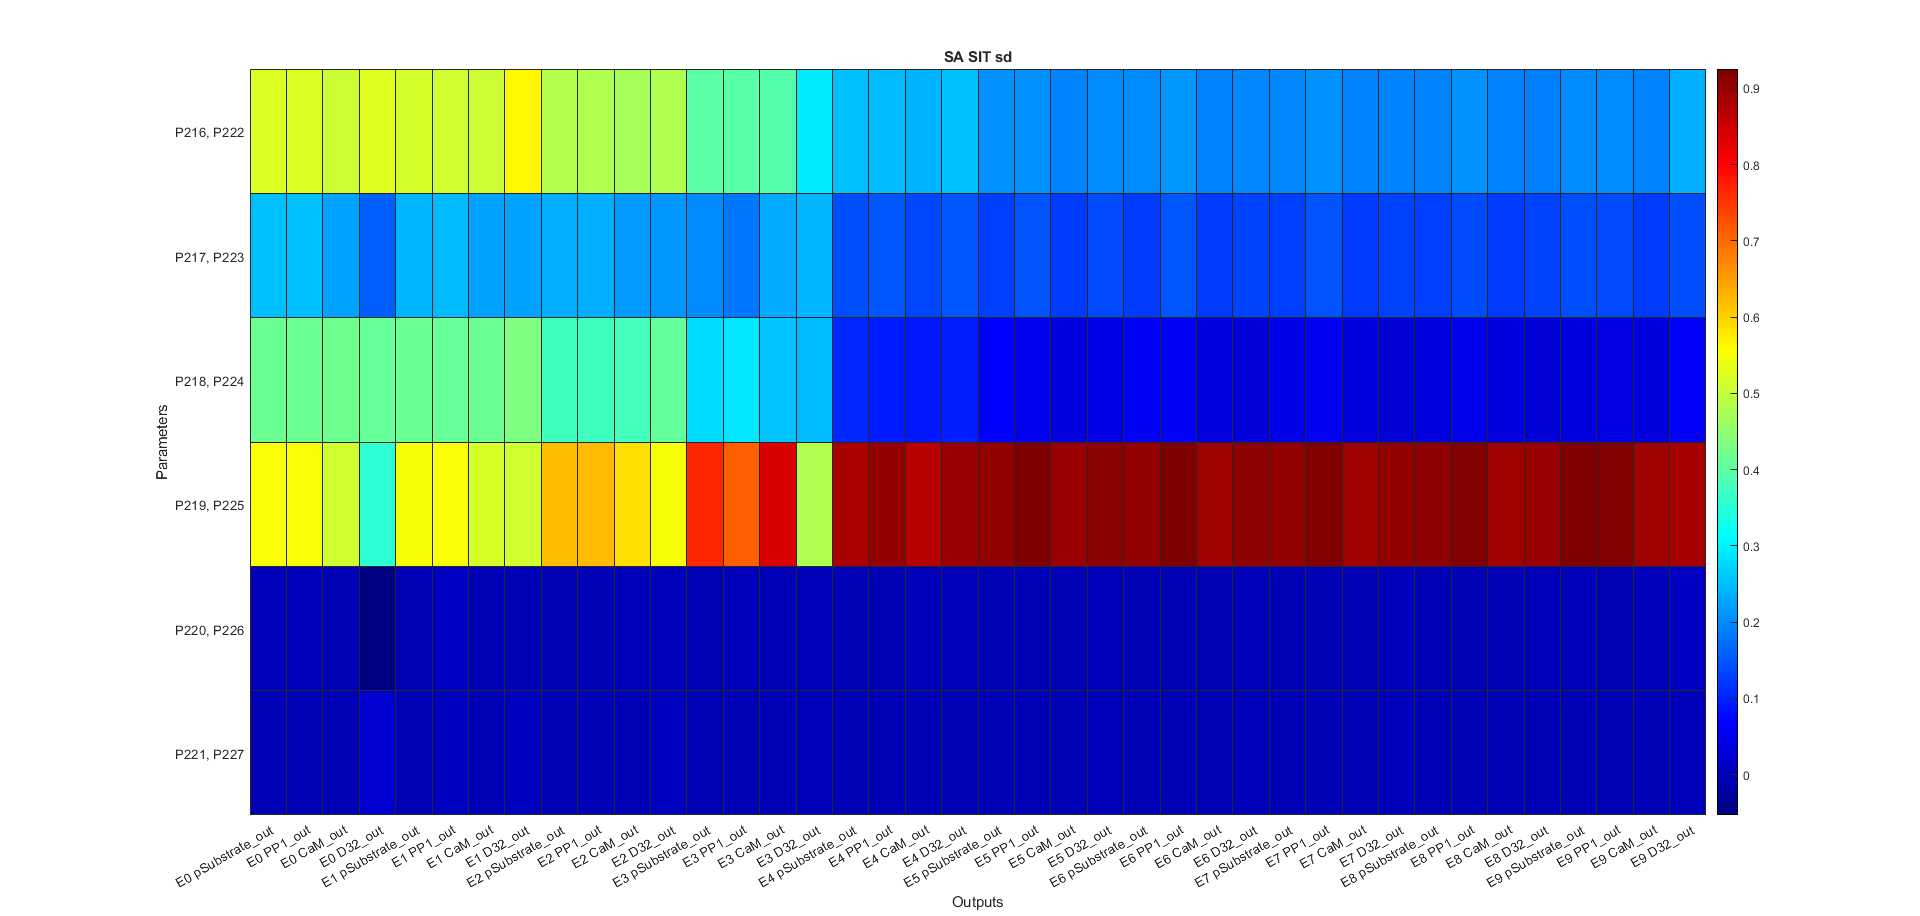
Code figures SA
  1function f_plot_gsa_sensitivities(rst,stg,sbtab)
  2% Generates figures for Sensitivity Analysis
  3
  4% Get the total number of outputs
  5[~,outputNames.sd] = f_get_outputs(stg,sbtab);
  6
  7for n = 1:size(outputNames.sd,2)
  8    outputNames.sd{n}{:} = strrep(outputNames.sd{n}{:},"_","\_");
  9end
 10for n = stg.exprun
 11    outputNames.se{n} = "E " + string(n-1);
 12end
 13
 14outputNames.xfinal = outputNames.sd;
 15
 16parNames = cell(1,stg.parnum);
 17parNames2 = cell(1,stg.parnum);
 18
 19for n = 1:stg.parnum
 20    parNames{n} = char("P" + find(stg.partest==n));
 21end
 22
 23for n = 1:size(parNames,2)
 24    parNames2{n} = string(parNames{n}(1,:));
 25    for m = 2:size(parNames{n},1)
 26        parNames2{n} = string(parNames2{n}) + ", " +...
 27            string(parNames{n}(m,:));
 28    end
 29end
 30
 31% Bootstrapping quartile mean of first order Sensitivity index for score
 32% per Experimental Output
 33f_generate_plot(rst,stg,outputNames,parNames2,...
 34    "Si seo bm",...
 35    "First order Sensitivities calculated using the Score of each Experimental Output  (Bootstrapping Mean)",...
 36    "outputNames.sd",...
 37    "transpose(reshape(mean(rst.SiQ.sd(:,:,1:stg.parnum)),[size(rst.SiQ.sd,2),size(rst.SiQ.sd,3)]))")
 38
 39% Bootstrapping quartile mean of total order Sensitivity index for score
 40% per Experimental Output
 41f_generate_plot(rst,stg,outputNames,parNames2,"SiT seo bm",...
 42    "Total order Sensitivities calculated using the Score of each Experimental Output (Bootstrapping Mean)",...
 43    "outputNames.sd",...
 44    "transpose(reshape(mean(rst.SiTQ.sd(:,:,1:stg.parnum)),[size(rst.SiQ.sd,2),size(rst.SiQ.sd,3)]))")
 45
 46% Bootstrapping quartile mean of first order Sensitivity index for score
 47% per Experiments
 48f_generate_plot(rst,stg,outputNames,parNames2,"Si se bm",...
 49    "First order Sensitivities calculated using the Score of each Experiment(Bootstrapping Mean)",...
 50    "outputNames.se",...
 51    "transpose(reshape(mean(rst.SiQ.se(:,:,1:stg.parnum)),[size(rst.SiQ.se,2),size(rst.SiQ.se,3)]))")
 52
 53% Bootstrapping quartile mean of total order Sensitivity index for score
 54% per Experiments
 55f_generate_plot(rst,stg,outputNames,parNames2,"SiT se bm",...
 56    "Total order Sensitivities calculated using the Score of each Experiment (Bootstrapping Mean)",...
 57    "outputNames.se",...
 58    "transpose(reshape(mean(rst.SiTQ.se(:,:,1:stg.parnum)),[size(rst.SiQ.se,2),size(rst.SiQ.se,3)]))")
 59
 60% Bootstrapping quartile mean of first order Sensitivity index for the
 61% final points of the simulations for the output beeing measured
 62f_generate_plot(rst,stg,outputNames,parNames2,"Si xfinal bm",...
 63    "First order Sensitivities calculated using the final value of each Experimental Output (Bootstrapping Mean)",...
 64    "outputNames.xfinal",...
 65    "transpose(reshape(mean(rst.SiQ.xfinal(:,:,1:stg.parnum)),[size(rst.SiQ.xfinal,2),size(rst.SiQ.xfinal,3)]))")
 66
 67% Bootstrapping quartile mean of total order Sensitivity index for the
 68% final points of the simulations for the output beeing measured
 69f_generate_plot(rst,stg,outputNames,parNames2,"SiT xfinal bm",...
 70    "Total order Sensitivities calculated using the final value of each Experimental Output (Bootstrapping Mean)",...
 71    "outputNames.xfinal",...
 72    "transpose(reshape(mean(rst.SiTQ.xfinal(:,:,1:stg.parnum)),[size(rst.SiQ.xfinal,2),size(rst.SiQ.xfinal,3)]))")
 73
 74figHandles = findobj('type', 'figure', 'name', 'Si,SiT');
 75close(figHandles);
 76figure('WindowStyle', 'docked','Name','Si,SiT', 'NumberTitle', 'off');
 77
 78for n = 1:size(parNames2,2)
 79    a{n} = char(parNames2{n});
 80end
 81
 82a = categorical(a,a);
 83
 84bar(a,[transpose(rst.Si.st(:,1:stg.parnum)),...
 85    transpose(rst.SiT.st(:,1:stg.parnum))])
 86xlabel('Parameters');
 87ylabel('Sensitivity');
 88title('Sensitivities calculated using the sum of the Score of all Experiments');
 89legend({'SI','SIT'});
 90legend boxoff
 91
 92figHandles = findobj('type', 'figure', 'name', 'Si,SiT b');
 93close(figHandles);
 94figure('WindowStyle', 'docked','Name','Si,SiT b', 'NumberTitle', 'off');
 95
 96T = [];
 97
 98for n = 1:size(a,2)
 99    for m = 1:size(rst.SiQ.st(:,n),1)
100 T = [T;table(rst.SiQ.st(m,n),a(n),"Si")];
101    end
102end
103for n = 1:size(a,2)
104    for m = 1:size(rst.SiTQ.st(:,n),1)
105 T = [T;table(rst.SiTQ.st(m,n),a(n),"SiT")];
106    end
107end
108
109boxchart(T.Var2,T.Var1,'GroupByColor',T.Var3,'MarkerStyle','.','JitterOutliers','on')
110xlabel('Parameters');
111ylabel('Sensitivity');
112title('Sensitivities calculated using the sum of the Score of all Experiments (Bootstrapping)');
113legend({'Si','SiT'},'Location','best');
114legend boxoff
115end
116
117function f_generate_plot(rst,stg,outputNames,parNames2,name,title,...
118    helprer1,helprer2)
119
120eval("figHandles = findobj('type', 'figure', 'name', '" + name + "');")
121close(figHandles);
122eval("figure('WindowStyle', 'docked','Name','" + name +...
123    "','NumberTitle', 'off');")
124
125heatmap_fixer = eval(helprer1);
126heatmap_fixer=heatmap_fixer(~cellfun('isempty',heatmap_fixer));
127
128heatmap_fixer2 = eval(helprer2);
129heatmap_fixer2 = heatmap_fixer2(:,all(~isnan(heatmap_fixer2)));
130
131h = heatmap(heatmap_fixer,parNames2,heatmap_fixer2,'Colormap',turbo,...
132    'ColorLimits',[0 1],'GridVisible','off');
133h.CellLabelFormat = '%.2f';
134
135eval(" h.Title = """ + title + """;")
136h.XLabel = 'Outputs';
137h.YLabel = 'Parameters';
138end
Calls
Loads - data.mat
f_get_subplot
Code
 1function [fig_n,layout] = f_get_subplot(plot_tn,plot_n,fig_n,fig_name,layout)
 2
 3% size_x = 4;
 4% size_y = 6;
 5size_t = 24;
 6% ratio_1 = 3;
 7% ratio_2 = 4;
 8
 9
10size_x = [1,1,1,2,3,3,4,4,3,4,4,4,5,5,5,4,5,5,5,5,6,6,6,6];
11size_y = [1,2,3,2,2,2,2,2,3,3,3,3,3,3,3,4,4,4,4,4,4,4,4,4];
12
13% If the amount of plots is bigger thatn the maximum amount of plots per
14% figure subdivide the plots to more than one figure
15% if plot_tn > 24
16%     % Generate a new figure for the first plot and each time the number of
17%     % plots is greater than figure number divided by max plot number per
18%     % figure
19%     if mod(plot_n-1,24) == 0
20%
21%         fig_n = fig_n + 1;
22%
23%         %Close previous instances of the figure and generates a new one
24%         figHandles = findobj('type', 'figure', 'name', fig_name + " " + fig_n);
25%         close(figHandles);
26%         figure('WindowStyle', 'docked','Name', fig_name + " " + fig_n,'NumberTitle', 'off');
27%         sgtitle(fig_name + " " + fig_n);
28%         layout = tiledlayout(ceil(sqrt(24/6)*2),ceil(sqrt(24/6)*3),'Padding','none','TileSpacing','compact');
29%     end
30%
31%     % Get the correct subploting position for each plot
32% %     if plot_tn/24 < fig_n
33% %         subplot(ceil(sqrt((plot_tn-(fig_n-1)*24)/6)*2),ceil(sqrt((plot_tn-(fig_n-1)*24)/6)*3),plot_n-(fig_n-1)*24)
34% %     else
35% %         subplot(ceil(sqrt(24/6)*2),ceil(sqrt(24/6)*3),plot_n-(fig_n-1)*24)
36% %     end
37% else
38
39    % Generate a new figure for the first plot
40    if mod(plot_n-1,size_t) == 0
41
42        %Close previous instances of the figure and generates a new one
43        figHandles = findobj('type', 'figure', 'name', fig_name);
44        close(figHandles);
45        figure('WindowStyle', 'docked','Name', fig_name, 'NumberTitle', 'off');
46        sgtitle(fig_name);
47%         layout = tiledlayout(...
48%             ceil(sqrt((plot_tn-fig_n*size_t)/(ratio_1*ratio_2))*ratio_1),...
49%             ceil(sqrt((plot_tn-fig_n*size_t)/(ratio_1*ratio_2))*ratio_2),...
50%             'Padding','none','TileSpacing','compact');
51        layout = tiledlayout(...
52            size_x(plot_tn-(floor(plot_tn/size_t)*size_t)),...
53            size_y(plot_tn-(floor(plot_tn/size_t)*size_t)),...
54            'Padding','none','TileSpacing','compact');
55
56%         title(layout,fig_name, 'FontSize', 16,'Fontweight','bold')
57        fig_n = fig_n + 1;
58
59    end
60
61    % Get the correct subploting position for each plot
62%     subplot(ceil(sqrt(plot_tn/6)*2),ceil(sqrt(plot_tn/6)*3),plot_n)
63
64% end
65end
Inputs
Outputs
Calls
Loads